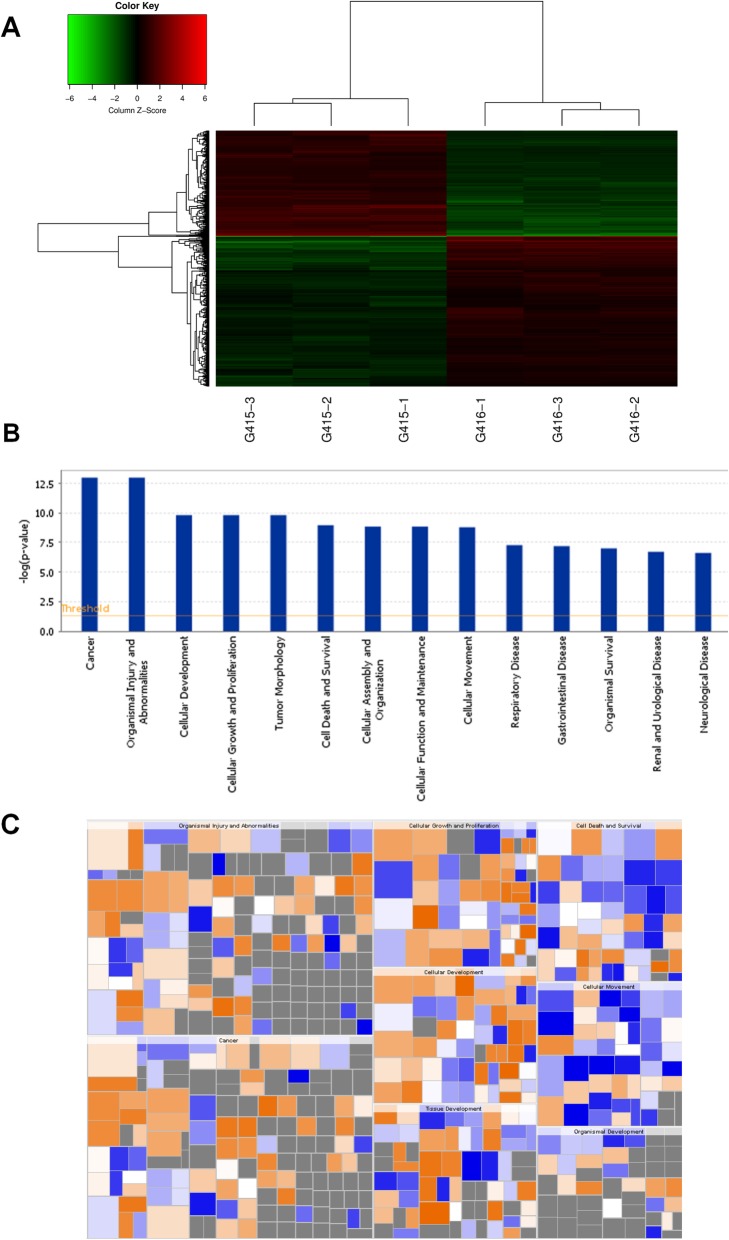
Fig. 1.
Gene chip detection after Prdx1 inhibition. a Changes of relevant genes in cells after inhibition of Prdx1. Negative control group: G415–1, G415–2, and G415–3. shPrdx1 group: G416–1, G416–2, and G416–3. The screening standard for a significant difference in gene expression was a value of |FC| greater than 1.3 and a P-value less than 0.05. Red signifies that the signal value of the gene is relatively up-regulated. Green signifies that the signal value of the gene is relatively down-regulated. Black signifies a moderate signal value of the gene. Grey signifies that no signal value was detected. b Differentially expressed genes in disease and cell functional classifications after Prdx1 inhibition in EC9706 cells. All diseases and cell functions were sequenced with -Log (P-value). c The effects of differentially expressed genes on cell function and diseases after Prdx1 inhibition. Orange signifies Z-score > 0. Blue signifies Z-score < 0. Grey signifies no Z-score value. Z-score > 2 signifies that the function is significantly activated. Z-score < − 2 signifies that the function is significantly inhibited

