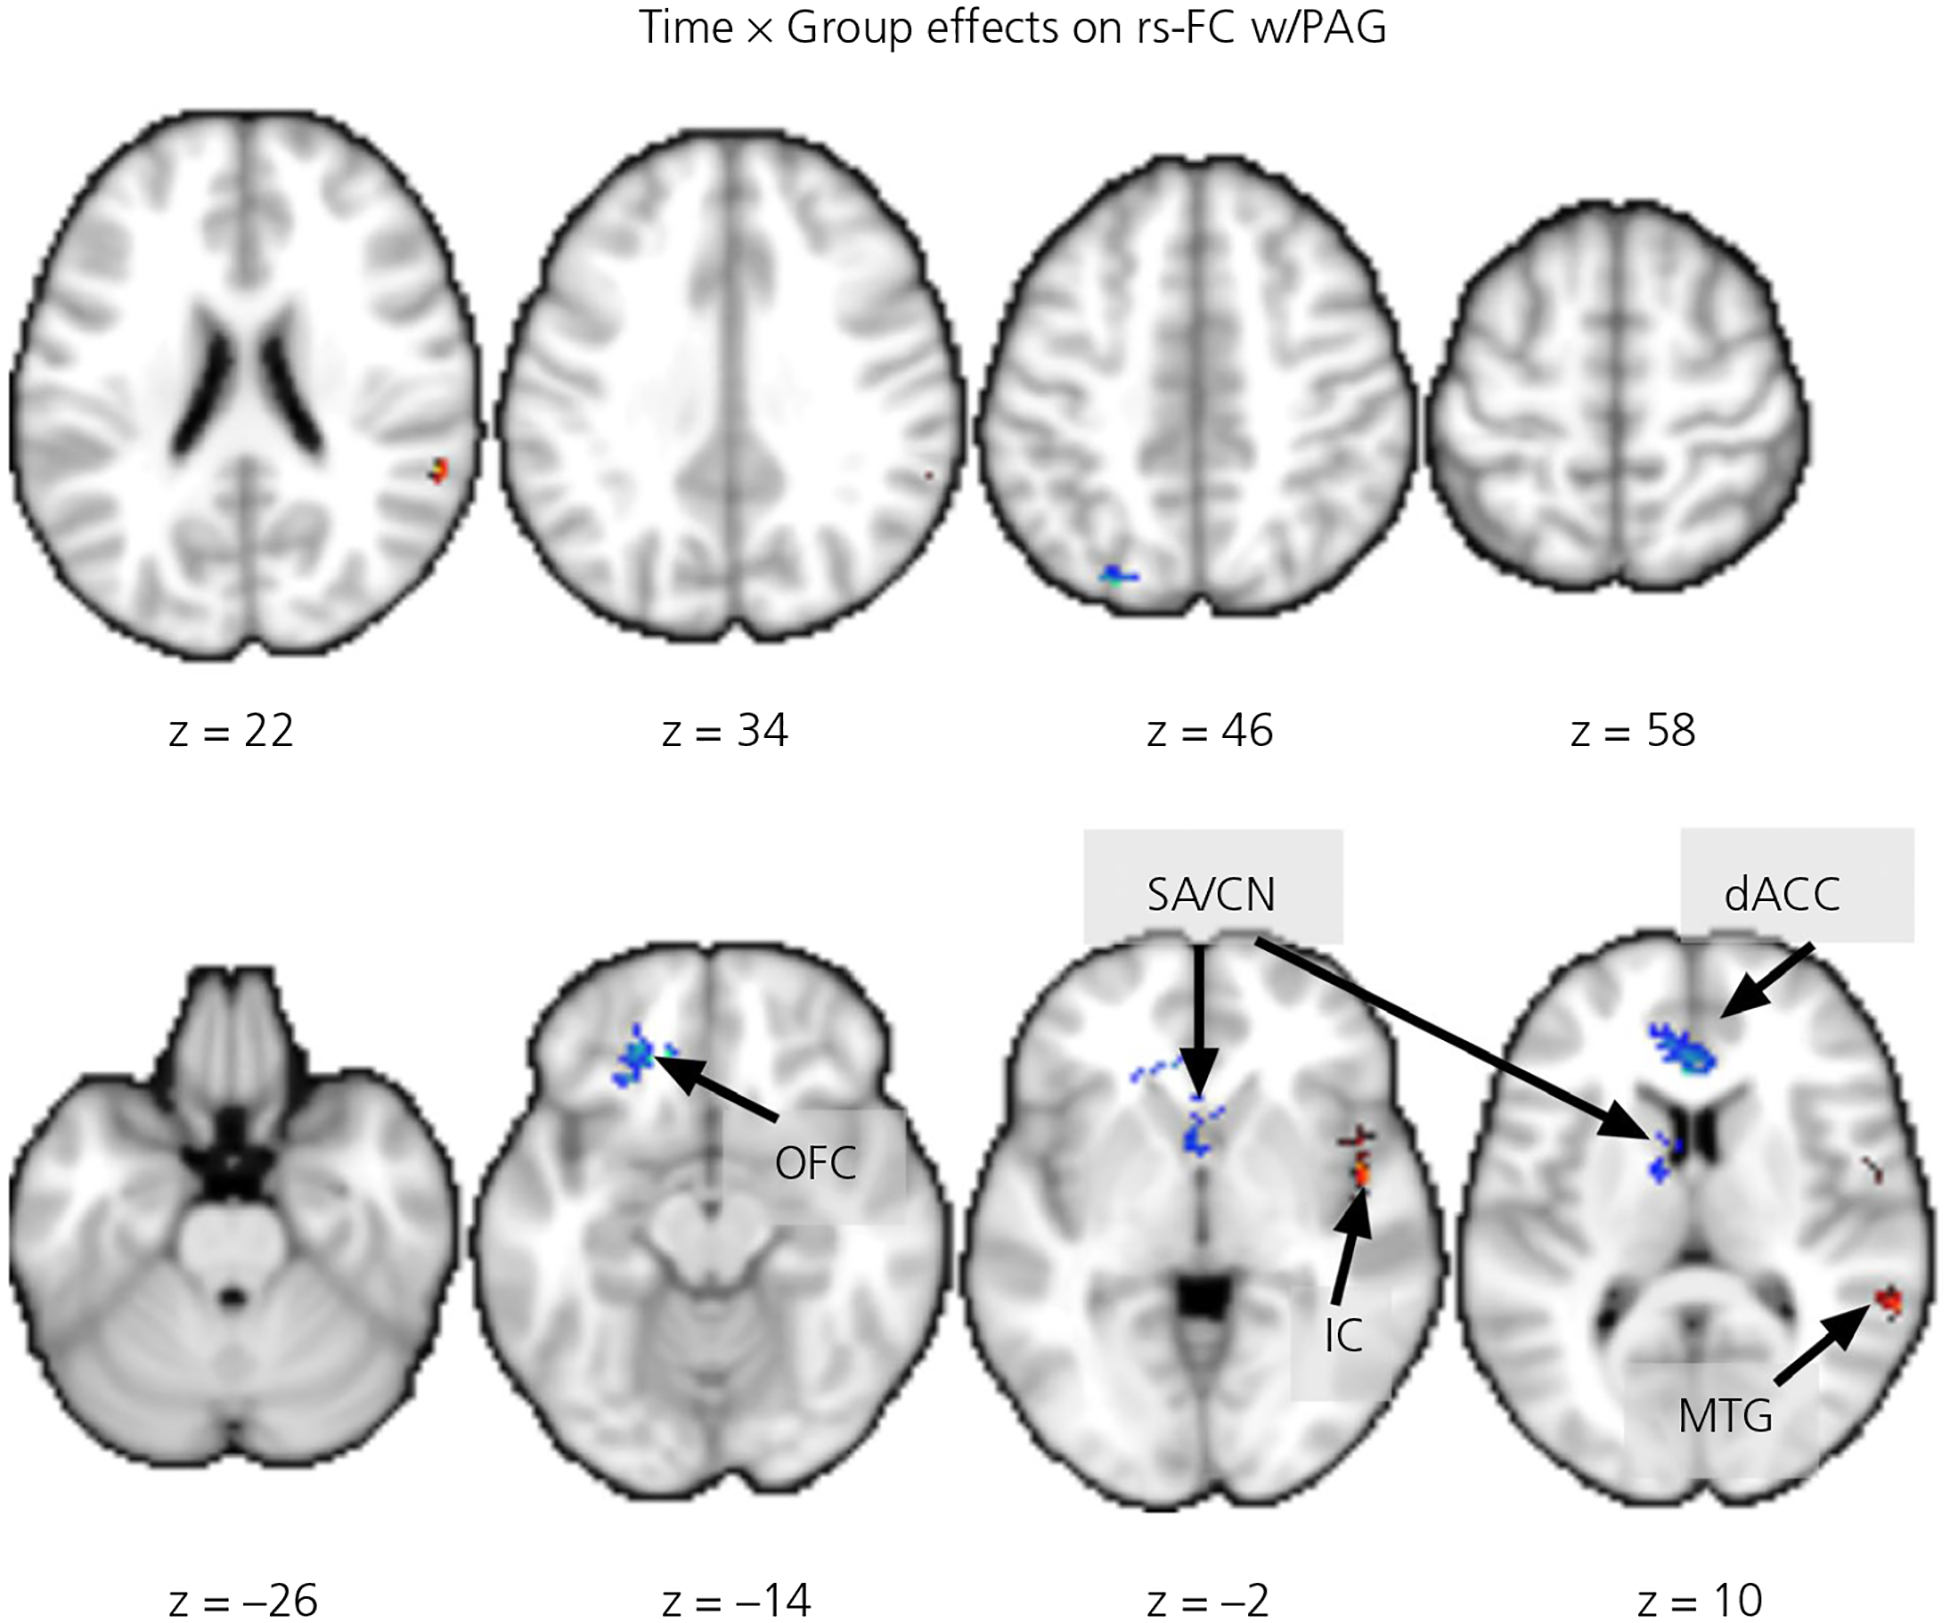
FIGURE 5.

The group by time interaction effects on the periaqueductal gray (PAG)-dependent resting-state functional connectivity (rs-FC). The red/warm colored clusters indicate buprenorphine treatment for opioid use disorder (BT) > comparison group (CG) in 1 month postpartum (T1) to 4 months postpartum (T2) increases and the blue/ winter colored clusters indicate BT > CG in T1-to-T2 decreases, all clusters shown are whole-brain corrected at the cluster level. Abbreviations: dACC, dorsal anterior cingulate cortex; IC, insular cortex; MTG, middle temporal gyrus; SA/CN, septal area/caudate nucleus; OFC, orbital frontal cortex. The z-coordinates of the slices are listed below the images, which are rendered in neurological convention (the right side of image is the right hemisphere)
