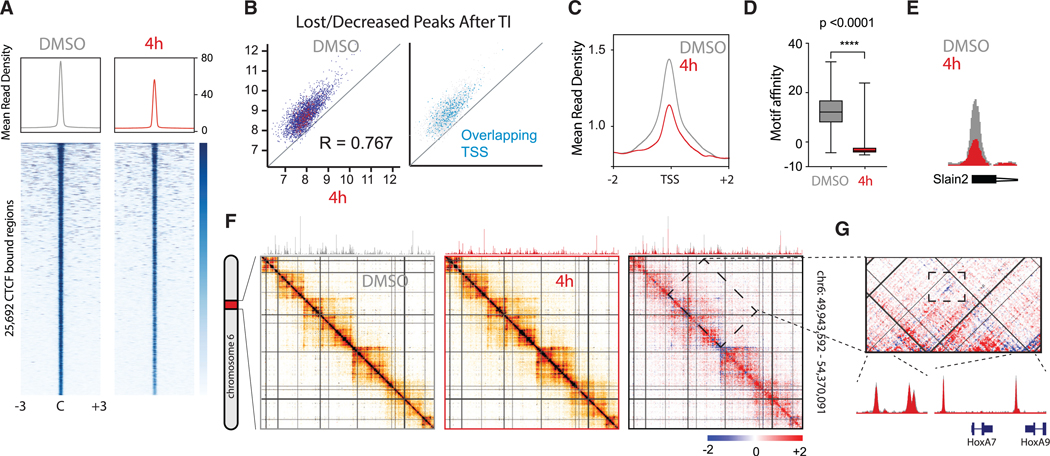
Figure 1. Transcriptional Inhibition Disrupts CTCF Binding Predominantly in TSS.
Transcription was inhibited in mESCs for 4 h with co-incubation of DRB and triptolide. Cells incubated with DMSO served as control.
(A) Shows CTCF ChIP-seq heatmaps centered and rank-ordered on CTCF-binding sites. Corresponding average density profiles are plotted at the top of the heatmaps to illustrate differences between DMSO and 4 h of TI.
B) A subset of peaks exhibit dramatically reduced CTCF enrichment after 4 h of TI. Overlapping peaks for TSS are highlighted in blue.
(C) Average density profiles for the same ChIP-seq as (A) but centered on TSS.
(D) Boxplot showing the motif affinity scores for CTCF-binding sites lost after transcriptional inhibition versus a random set of CTCF-binding sites in the control (Mann-Whitney test, p < 0.0001).
(E) Representative example of a CTCF peak with decreased binding to the TSS of the Slain2 gene. ChIP-seq tracks for DMSO (gray) and 4 h of TI (red) are overlapped for comparison.
(F) 5C heatmap depicting the interaction frequency between restriction fragments across a 4 Mb region surrounding the HoxA cluster (data were binned in 15 kb windows; step size 5 kb; the median is shown). Comparative 5C heatmap shows increased (red) and decreased (blue) interactions after TI. Overlapped ChIP-seq tracks above illustrate decreased binding of CTCF. Darker colors represent increasing interaction frequency.
(G) Zoom into a chromatin domain delimited by CTCF sites (top). Overlapped ChIP-seq tracks for DMSO (gray) and 4 h of TI (red) illustrate no change in CTCF binding for the loop enclosed in a rectangle (bottom).

