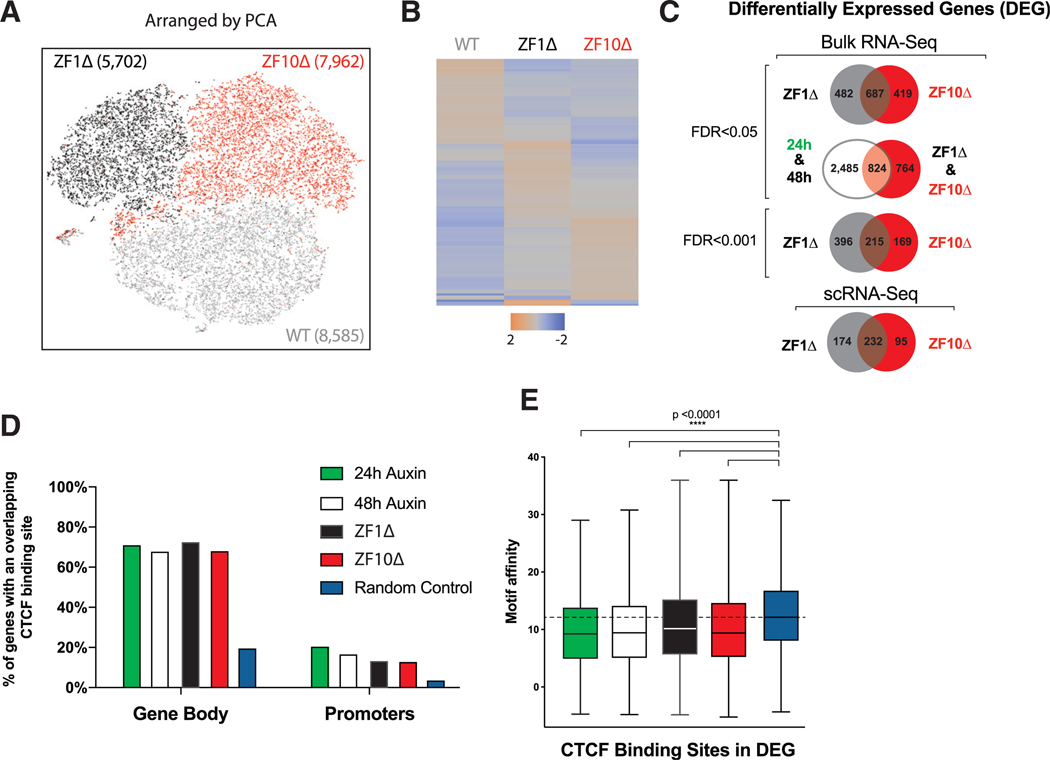
Figure 3. Gene Expression Defects Are Partially Preserved between RBR Deletions.
(A) Principal-component analysis (PCA)-based representation of single-cell RNA-seq data for rescue cell lines from WT (gray), ZF1Δ (black), and ZF10Δ (red). Each dot represents a single cell, and dots are arranged on the basis of PCA. The final number of cells sequenced per condition is noted in parentheses.
(B) Heatmaps depicting differentially expressed genes from scRNA-seq.
(C) Venn diagrams showing the overlap between differentially expressed genes for the different conditions and levels of significance.
(D) Bar graph illustrating the percentage of genes that have at least one CTCF-binding site for CTCF in the promoter region or gene body.
(E) Boxplot showing the motif affinity scores for CTCF-binding sites within DEG represented in (B) compared with a random sample of genes (Mann-Whitney test, p < 0.0001).

