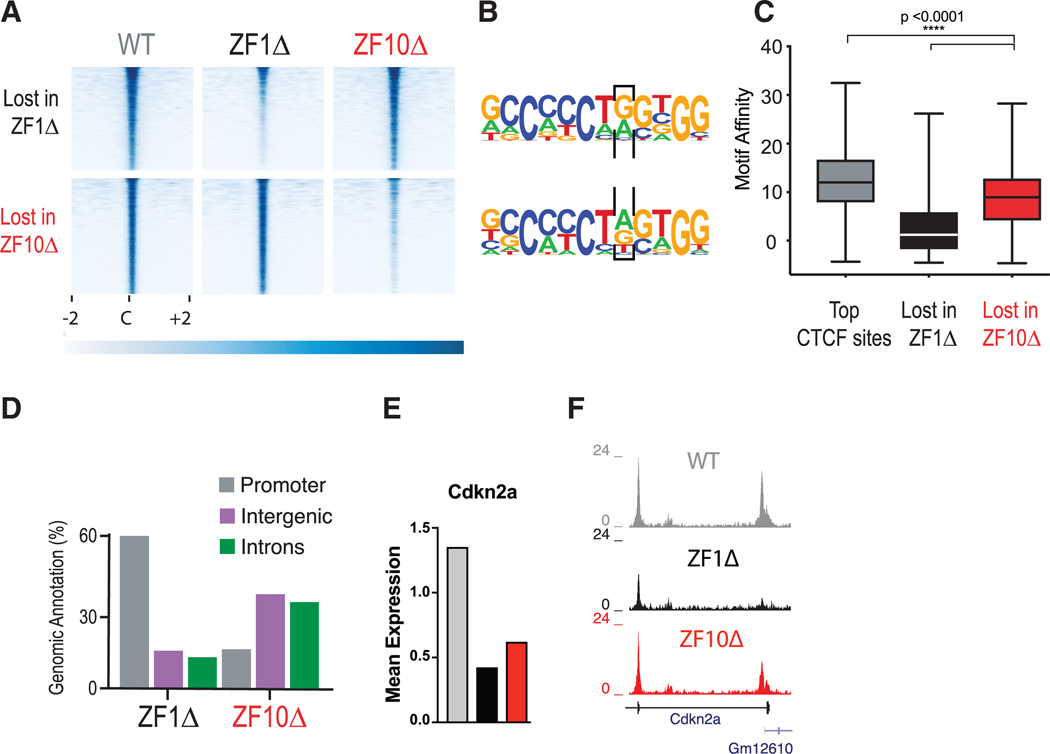
Figure 4. Deletion of RBRs in CTCF Disturb Its Chromatin Binding.
(A) CTCF ChIP-seq for WT (gray), ZF1Δ (black), and ZF10Δ (red) rescue cell lines. Heatmaps were generated by centering and rank-ordering on CTCF-binding sites. Those lost for ZF1Δ (top) or ZF10Δ (bottom) are shown.
(B) De novo motif discovery was called for binding sites in (A), and a black box encloses the eighth position in which A to G was specifically preferred by ZF1Δ.
(C) Boxplot showing the motif affinity scores for CTCF-binding sites in (A) compared with unchanged sites (Mann-Whitney test, p < 0.0001).
(D) Bar graph representing the top three genomic regions for CTCF sites in (A).
(E and F) Mean expression levels for differentially expressed gene Cdkn2a (E) and corresponding ChIP-seq tracks (F) under each condition.

