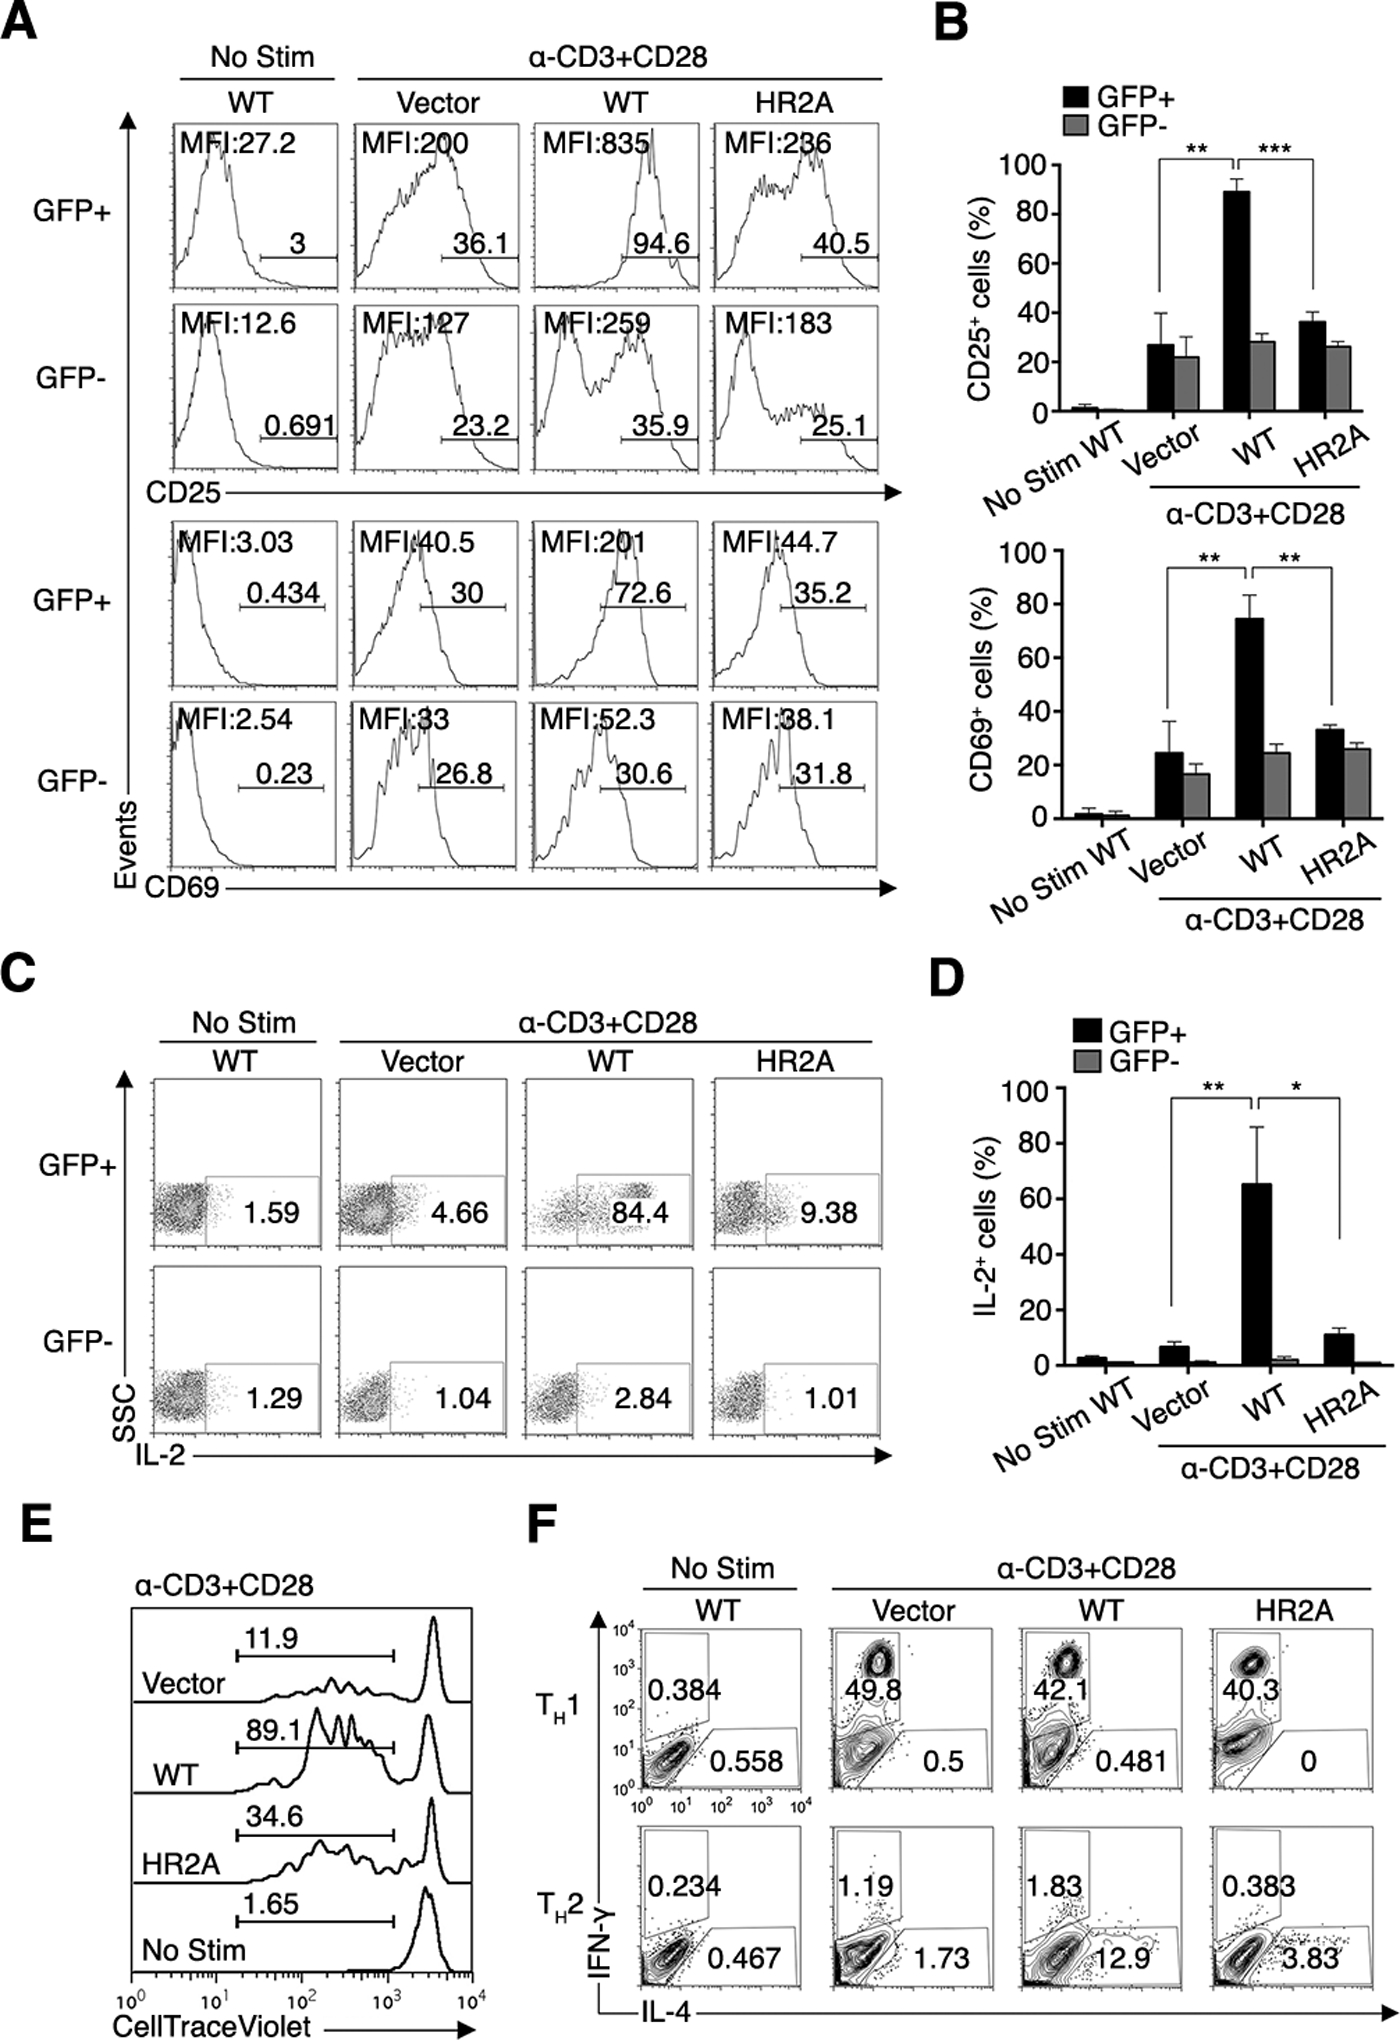
Fig. 2. Deficient activation of CD4+ T cells from BM chimeric mice reconstituted with PKCθ knockout BM cells expressing PKCθHR2A.

(A–D) Flow cytometry analysis of the surface abundance of CD25 and CD69 (A and B) and the production of IL-2 (C and D) by transduced (GFP+) or non-transduced (GFP−) naïve CD4+ T cells from BM chimeric mice reconstituted with PKCθ knockout BM cells expressing empty vector (vector), PKCθWT, or PKCθHR2A. Cells were left unstimulated or restimulated with CD3 and CD28 mAbs. Numbers above bracketed lines (A) and in the gated boxes (C) indicate % positive cells from a single representative mouse in each group. MFI values of CD25 and CD69 (A) or IL-2 (C) are shown, and averaged data pooled from six mice/group are shown in (B) and (D). *P < 0.05, **P < 0.01, ***P < 0.001. Results are representative of 4 independent experiments.
(E and F) Flow cytometry analysis of the proliferation (E) and the amounts of IFNγ (Th1) or IL-4 (Th2) cytokines (F) in sorted (GFP+) CD4+ cells as in (A to D). Numbers in (E) and (F) indicate the % of proliferating cells or the frequency of IFNγ- or IL-4-containing cells among gated CD4+ cells, respectively. Results are representative of 6 mice/group and 3 independent experiments.
