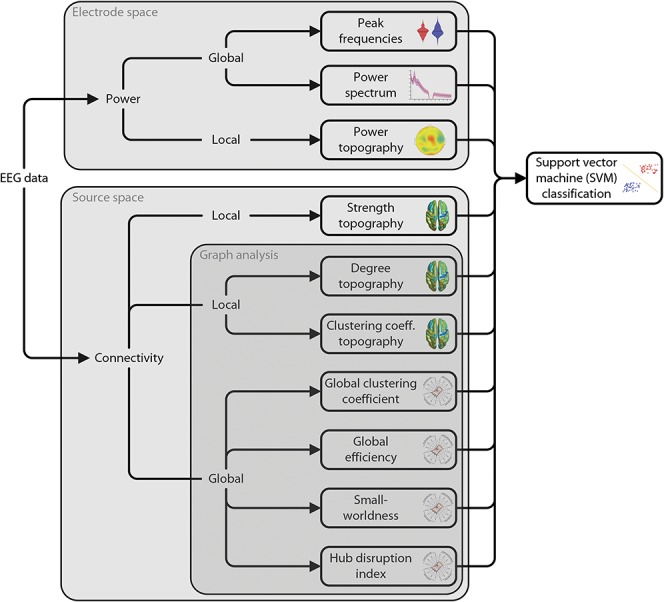
Figure 1.

Analysis pipeline. Electroencephalography data were analyzed with regards to power and connectivity, which quantify neural activity and neural communication, respectively. Power analyses were performed in electrode space. Analyses of functional connectivity were performed in source space. Connectivity analyses comprised phase-based (PLV, dwPLI) and amplitude-based (AEC) connectivity measures. Graph–theoretical network analysis was applied to further characterize functional connectivity. All measures were compared between chronic pain patients and healthy controls. In addition, a purely data-driven machine learning approach was adopted, using SVMs. The SVM was trained on all power and connectivity measures to distinguish between chronic pain patients and healthy controls. dwPLI, debiased weighted phase lag index; PLV, phase locking value; SVM, support vector machine.
