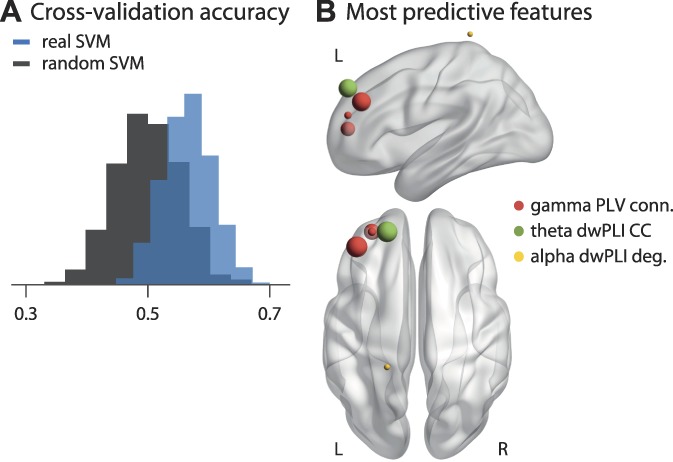
Figure 6.

Multivariate machine learning approach to classify chronic pain patients and healthy controls. (A) Distribution of mean accuracies resulting from a 10-fold cross-validation. The blue histogram shows the results trained on the actual data including all features of brain activity and connectivity. The gray histogram shows a support vector machine (SVM) trained on data with randomly permuted labels. The SVM trained on the real data shows an accuracy of 57 ± 4%, significantly higher than the accuracy of the SVM trained on randomly permuted data, 50 ± 5% (P < 0.001). (B) The 5 most predictive features, ie, those selected most consistently by the SVMs. Specific measures are color-coded, and the size of the spheres represents how often a specific feature was selected. The most frequently selected features were phase locking value (PLV)-based connectivity of the prefrontal cortex (MNI: −40, 30, 40 and −30, 50, 10) in the gamma band, which were selected in 15% and 12% of SVMs, respectively, and debiased weighted phase lag index (dwPLI) based clustering coefficient of the prefrontal cortex (MNI: −20, 50, 40) in the theta band, which was selected in 15% of SVMs. All other features were selected with a frequency of less than 10%. MNI, Montreal Neurological Institute.
