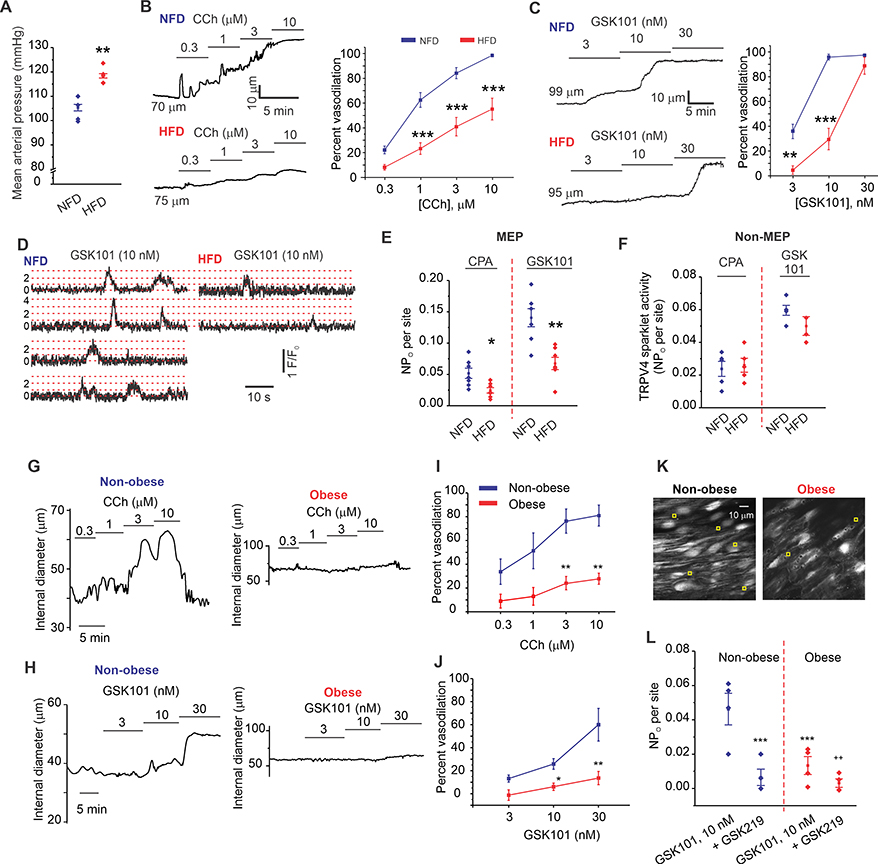
Figure 2. Diet-induced obesity impairs AKAP150EC-PKC-TRPV4EC signaling and vasodilation.
(A) Resting MAP (mm Hg) averaged over 3 days in HFD and NFD mice (n = 5; **P < 0.01 for HFD vs. NFD; t-test). (B) Representative diameter traces (left) and averaged diameter data (right) for CCh (0.3–10 μM)-induced dilation of MAs from NFD and HFD mice (n = 8–11; ***P < 0.001 for 1 μM, 3 μM, and 10 μM CCh for NFD vs. HFD mice; two-way ANOVA). (C) Representative diameter traces (left) and averaged diameter data (right) for GSK101 (3–30 nM)-induced vasodilation in NFD and HFD mice (n = 5–9; P < 0.01 [3 nM GSK10] and < 0.001 [10 nM GSK101]; two-way ANOVA). (D) Representative F/F0 traces from TRPV4EC sparklet sites (20 μM CPA + GSK101, 10 nM) at MEPs in Fluo-4–loaded en face preparations of MAs from NFD (left) and HFD (right) mice. Dotted red lines indicate quantal levels. (E) Averaged TRPV4EC sparklet activity (NPO) at MEPs in MAs from NFD and HFD mice under baseline conditions (20 μM CPA) or in response to GSK101 (10 nM) (n = 7; sparklet activity: *P < 0.05 [CPA] and < 0.01 [GSK101] for NFD vs. HFD). (F) Averaged TRPV4EC sparklet activity in MAs from NFD and HFD mice under baseline conditions (20 μM CPA) and in response to GSK101 (10 nM) (n = 7). (G) Representative diameter traces for CCh (0.3–10 μM)-induced dilation of splenius muscle arteries from non-obese and obese individuals. (H) Representative diameter traces for GSK101 (3–30 nM)-induced dilation of splenius muscle arteries from obese and non-obese individuals. (I) Averaged diameter data for CCh -induced vasodilation in human splenius and temporalis muscle arteries from obese and non-obese individuals (n = 6; P< 0.01 vs. non-obese; two-way ANOVA). (J) Averaged diameter data for GSK101-induced vasodilation in human splenius and temporalis muscle arteries from obese and non-obese individuals (n = 6; P < 0.01, < 0.01, vs. non-obese; two-way ANOVA). (K) Greyscale image of a field of view with ~ 20 ECs from an en face preparation of Fluo-4 loaded splenius muscle artery (SMA) from a non-obese individual; yellow squares indicate sparklet sites in with CPA + GSK101 (10 nM). (L) TRPV4EC sparklet activity (NPO) at MEP in SMAs from non-obese and obese individuals in response to GSK101 (10 nM) and in the presence of GSK219 (100 nM) (n = 4; P < 0.001 [GSK101] for non-obese vs. obese and P < 0.01 [GSK101] vs. [GSK219]; one-way ANOVA).

