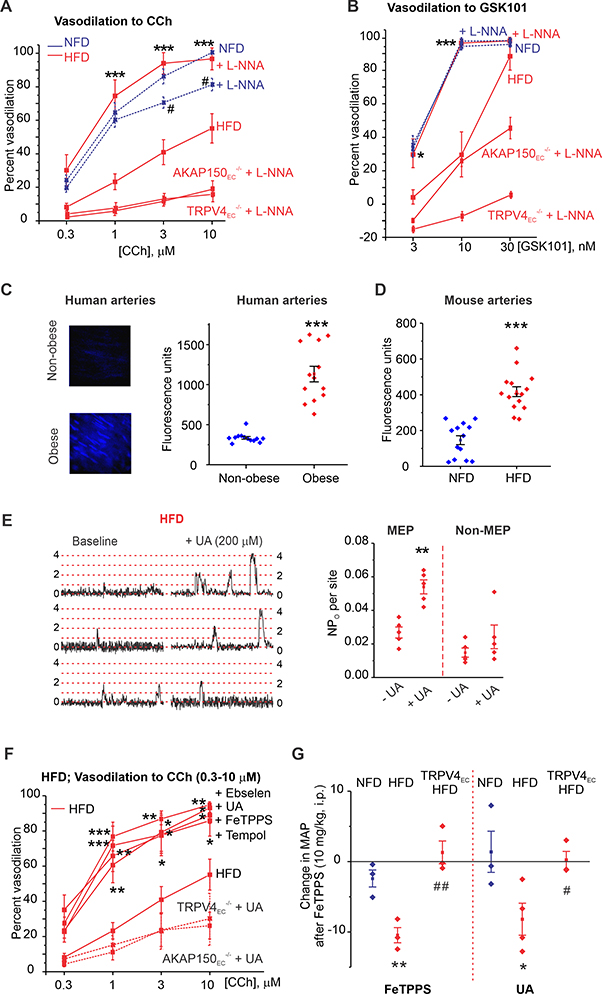
Figure 3. Elevation of endothelial peroxynitrite (PN) impairs TRPV4EC channel activity in obesity.
(A) Percent dilation of MAs from NFD, HFD, HFD AKAP150EC−/−, and HFD TRPV4EC−/− mice in response to CCh (0.3–10 μM) in the presence or absence of L-NNA (100 μM) (n = 5–9; #P<0.05 [3 and 10 μM CCh] for NFD vs. NFD + L-NNA; ***P < 0.001 [1, 3, and 10 μM CCh] for HFD vs. HFD + L-NNA; two-way ANOVA). (B) Percent dilation of MAs from NFD, HFD, HFD AKAP150EC−/−, and HFD TRPV4EC−/− mice in response to GSK101 (3–30 nM) in the presence or absence of L-NNA (100 μM) (n = 5; *P < 0.05 at 3 nM GSK101 and < 0.001 at 10 nM GSK101 for HFD vs. HFD + L-NNA; two-way ANOVA).(C) Representative images for CBA fluorescence in ECs of splenius muscle arteries from non-obese (top-left) and obese (bottom-left) individuals; scatter plot of CBA fluorescence intensity (right) in ECs from non-obese and obese patients (P < 0.001; n= 12 fields from 3 arteries; t-test). (D) CBA fluorescence intensity in ECs of MAs from NFD and HFD mice (P < 0.001; n = 13–15 fields from 3 arteries; t-test). (E) Representative F/F0 traces (left) and scatter plot of TRPV4EC sparklet activity (right) from MEP and non-MEP sites in fluo-4–loaded MAs from HFD mice in the absence or presence of UA (200 μM) (n = 5; P < 0.01 for MEP sites with vs. without UA; one-way ANOVA). Dotted red lines indicate quantal levels. (F) Effects of UA (200 μM), FeTPPS (1 μM), tempol (200 μM), and Ebselen (1 μM) on CCh (0.3–10 μM)-induced dilation of MAs from HFD mice (WT), TRPV4EC−/− HFD, and AKAP150EC−/− HFD mice (n = 5–8; P < 0.05; < 0.01; <0.001 vs. HFD only; two-way ANOVA). (G) Changes in resting MAP (mm Hg) in NFD and HFD mice following i.p. injection of FeTPPS (10 mg/kg; left) (n = 3–4; P < 0.01 for FeTPPS-treated NFD vs. FeTPPS-treated HFD, ##P < 0.01 for FeTPPS-treated HFD vs. FeTPPS-treated TRPV4EC−/− HFD; one-way ANOVA) or UA (200 mg/kg; right) (n = 3; P < 0.05 for UA-treated NFD vs. UA-treated HFD, #P < 0.05 for UA-treated HFD vs. UA-treated TRPV4EC−/− HFD; one-way ANOVA).

