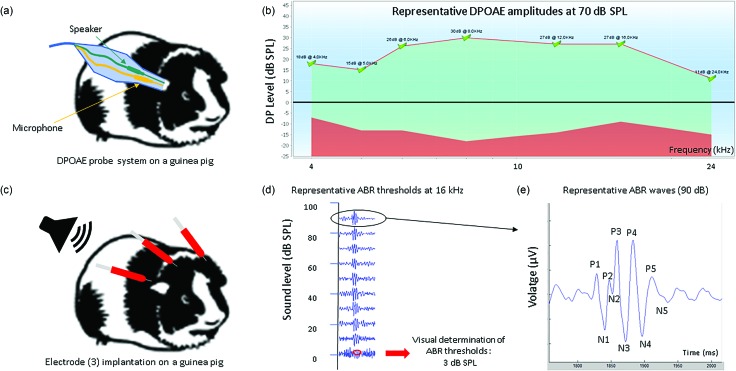
FIG. 2.
(a) Schematic cartoon of the probe microphone assembly entering the ear for distortion-product otoacoustic emission (DPOAE) measurement; tones are delivered via the speaker (green) and emissions are measured using the microphone (yellow). (b) Normal DPOAE amplitude in the guinea pig is shown for test signals of 70 dB SPL. (c) Schematic cartoon illustrating three electrode locations used to record the ABR. (d) Tones are presented at decreasing levels from 0 to 90 dB SPL and ABR threshold is determine based on visual inspection of waveforms. (e) Typical ABR waveforms (16 kHz, 90 dB SPL) illustrating the peaks (P) and troughs (N), defining each wave amplitude. The five marked waves (P1–P5) reflect specific central activity. P1: auditory nerve; P2: cochlear nucleus; P3: superior olivary complex; P4: lateral lemniscus; P5: inferior colliculus. (Unpublished data collected at CILcare.)

