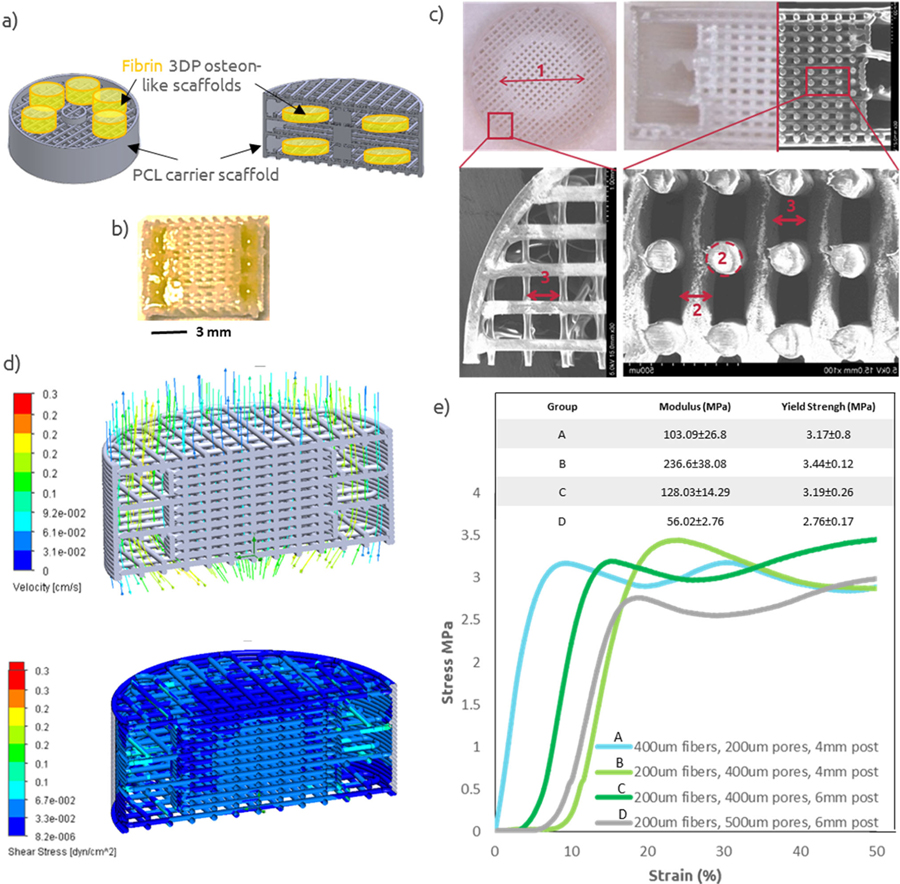
Figure II: PCL Carrier Scaffold Characterization.
(a) Schematic of 3D printed osteon-like scaffolds (green) and PCL carrier scaffold (gray). (b) Micrograph of a 3D printed PCL/Fibrin scaffold. Yellow food coloring was added to the fibrin bioink for photography purpose. (c) Micrograph and SEM images of 3D printed PCL scaffolds, with variable central post diameter (1), fiber diameter (2), and pore size (3). (d) Computational modeling of flow and shear stress within 3DP scaffolds while under perfusion. (e) strain-stress curve for four representative examples of 3DP PCL scaffolds (n=4). All data points represent mean +/− standard deviation.

