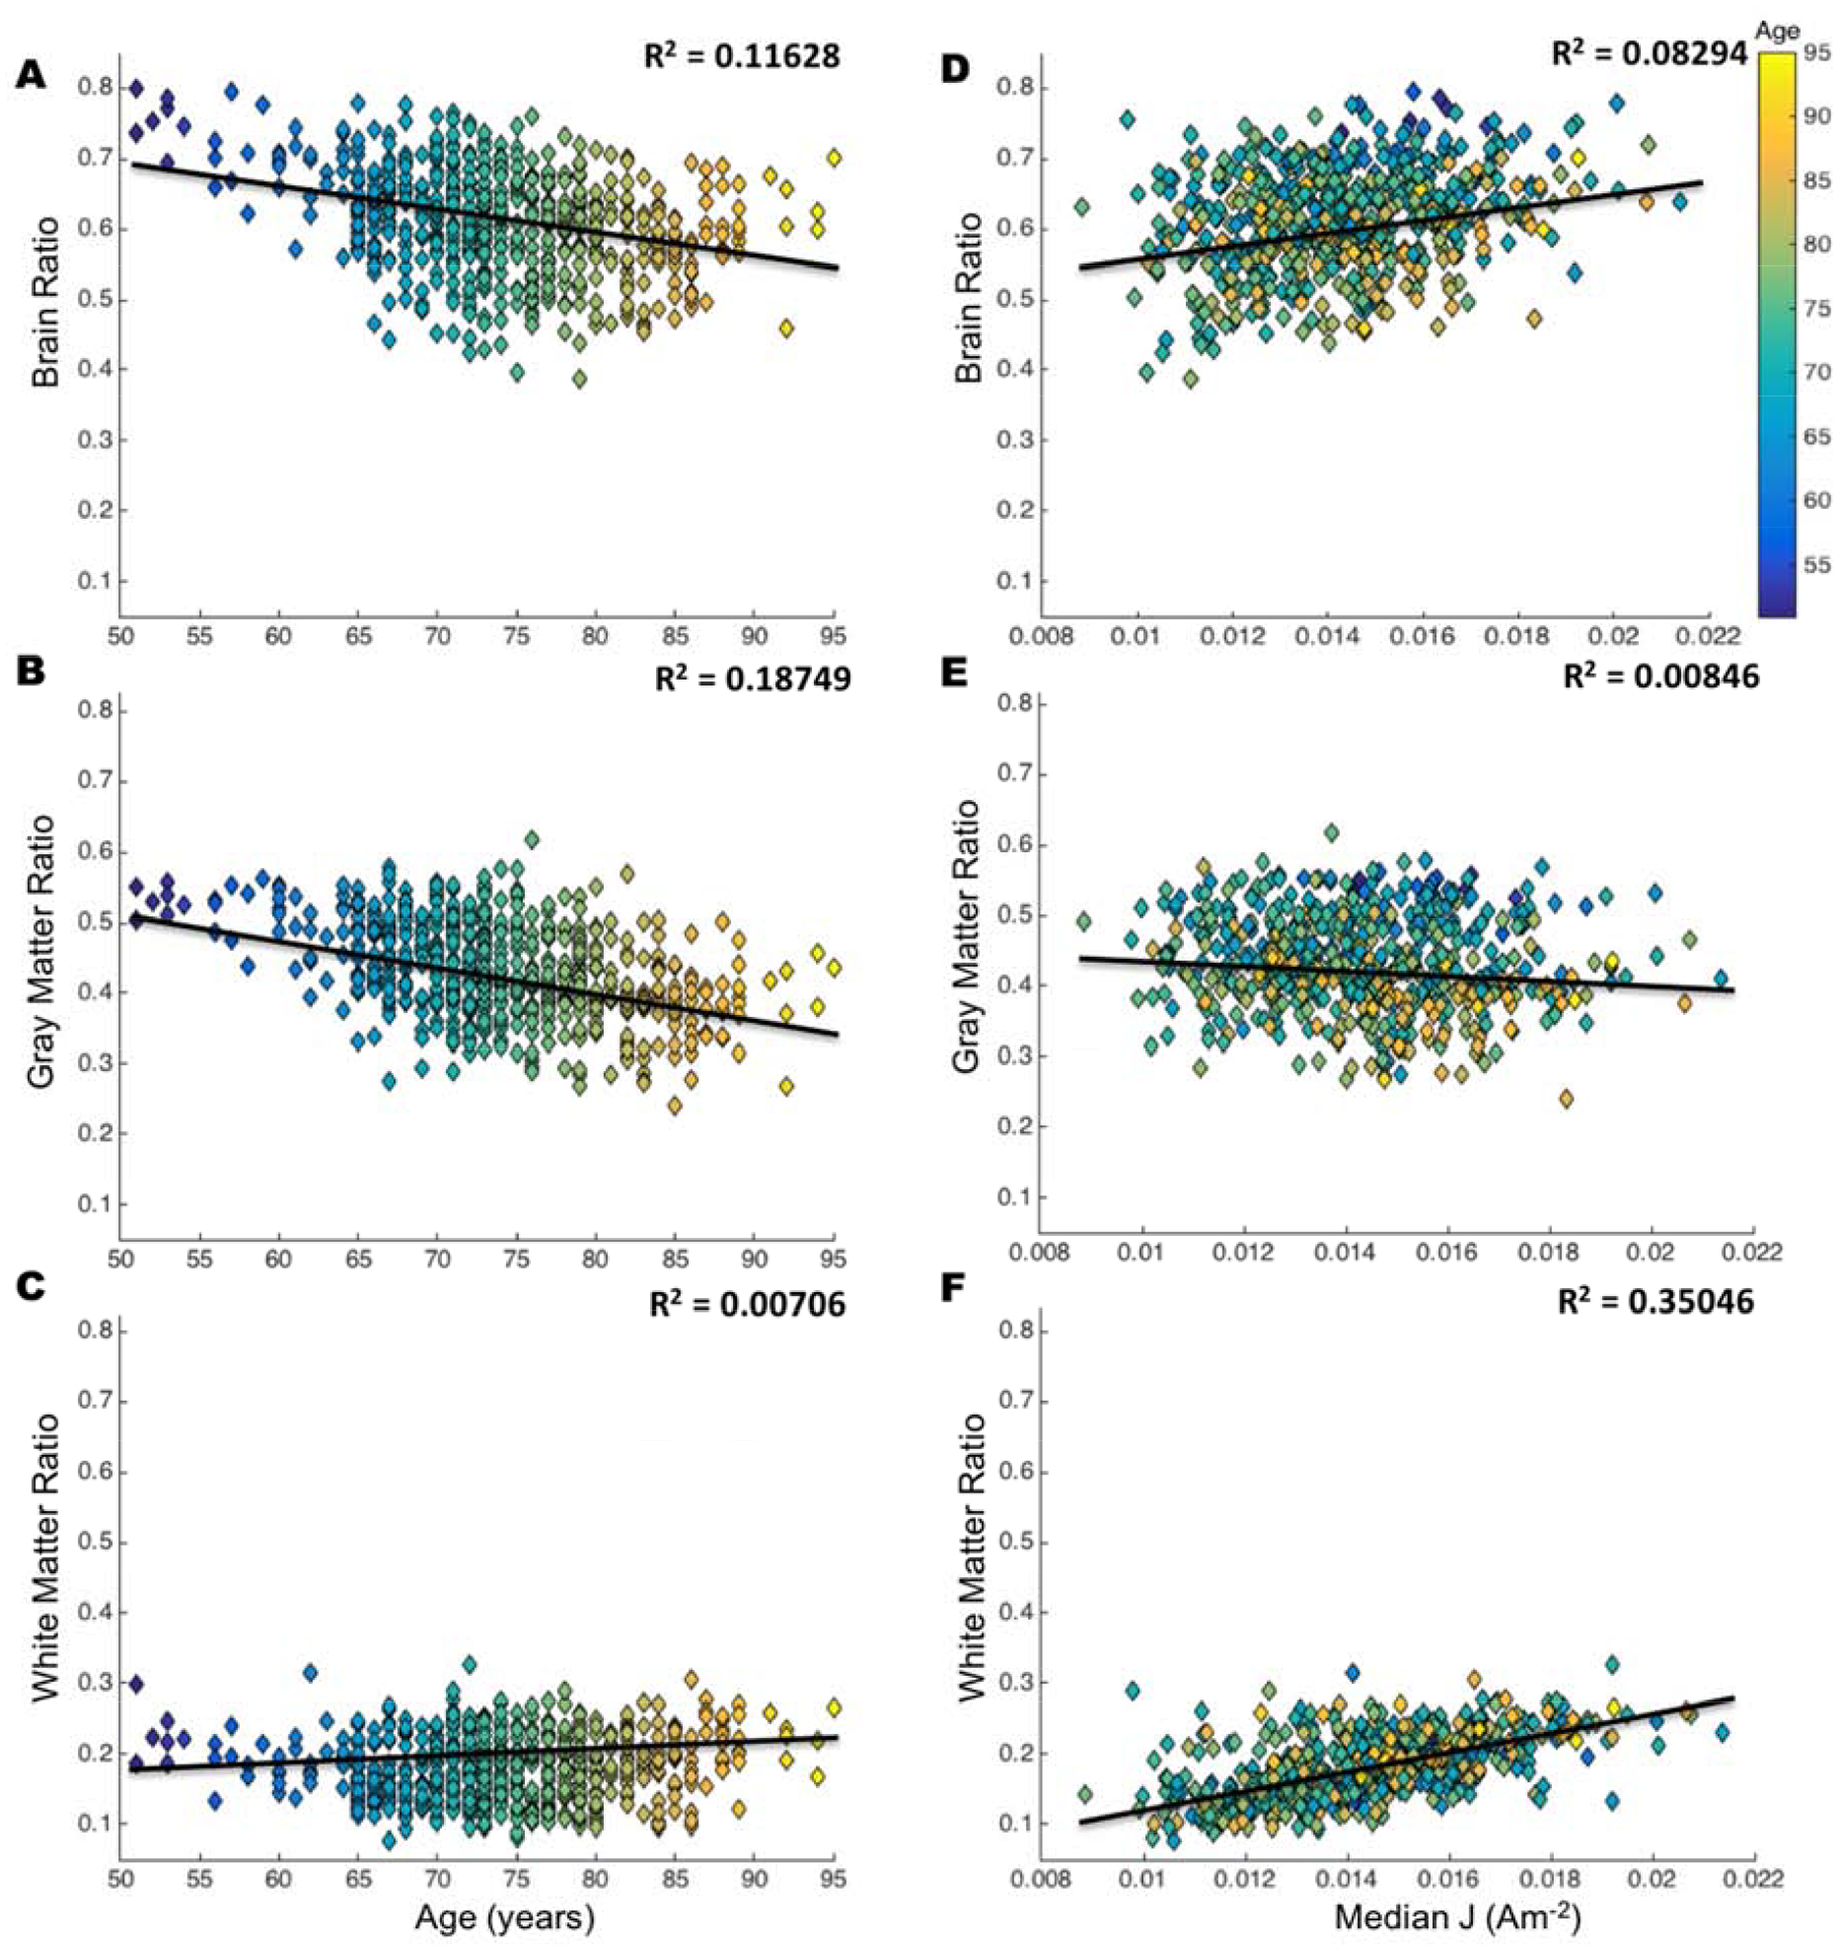
Figure 4.

Relationship of brain ratio with age and median current density (J). Each plot is color coded based on age from the youngest (blue) to oldest (yellow). Volume ratio is computed in equation (1), brain is a combination of white and gray matter. Correlation values (R2) indicate the relationship between A) brain ratio and age, B) gray matter ratio and age, C) white matter and age, D) brain ratio and median J, E) gray matter ratio and median J, and F) white matter and median J. Smaller values of volume ratio indicate an increase in atrophy.
