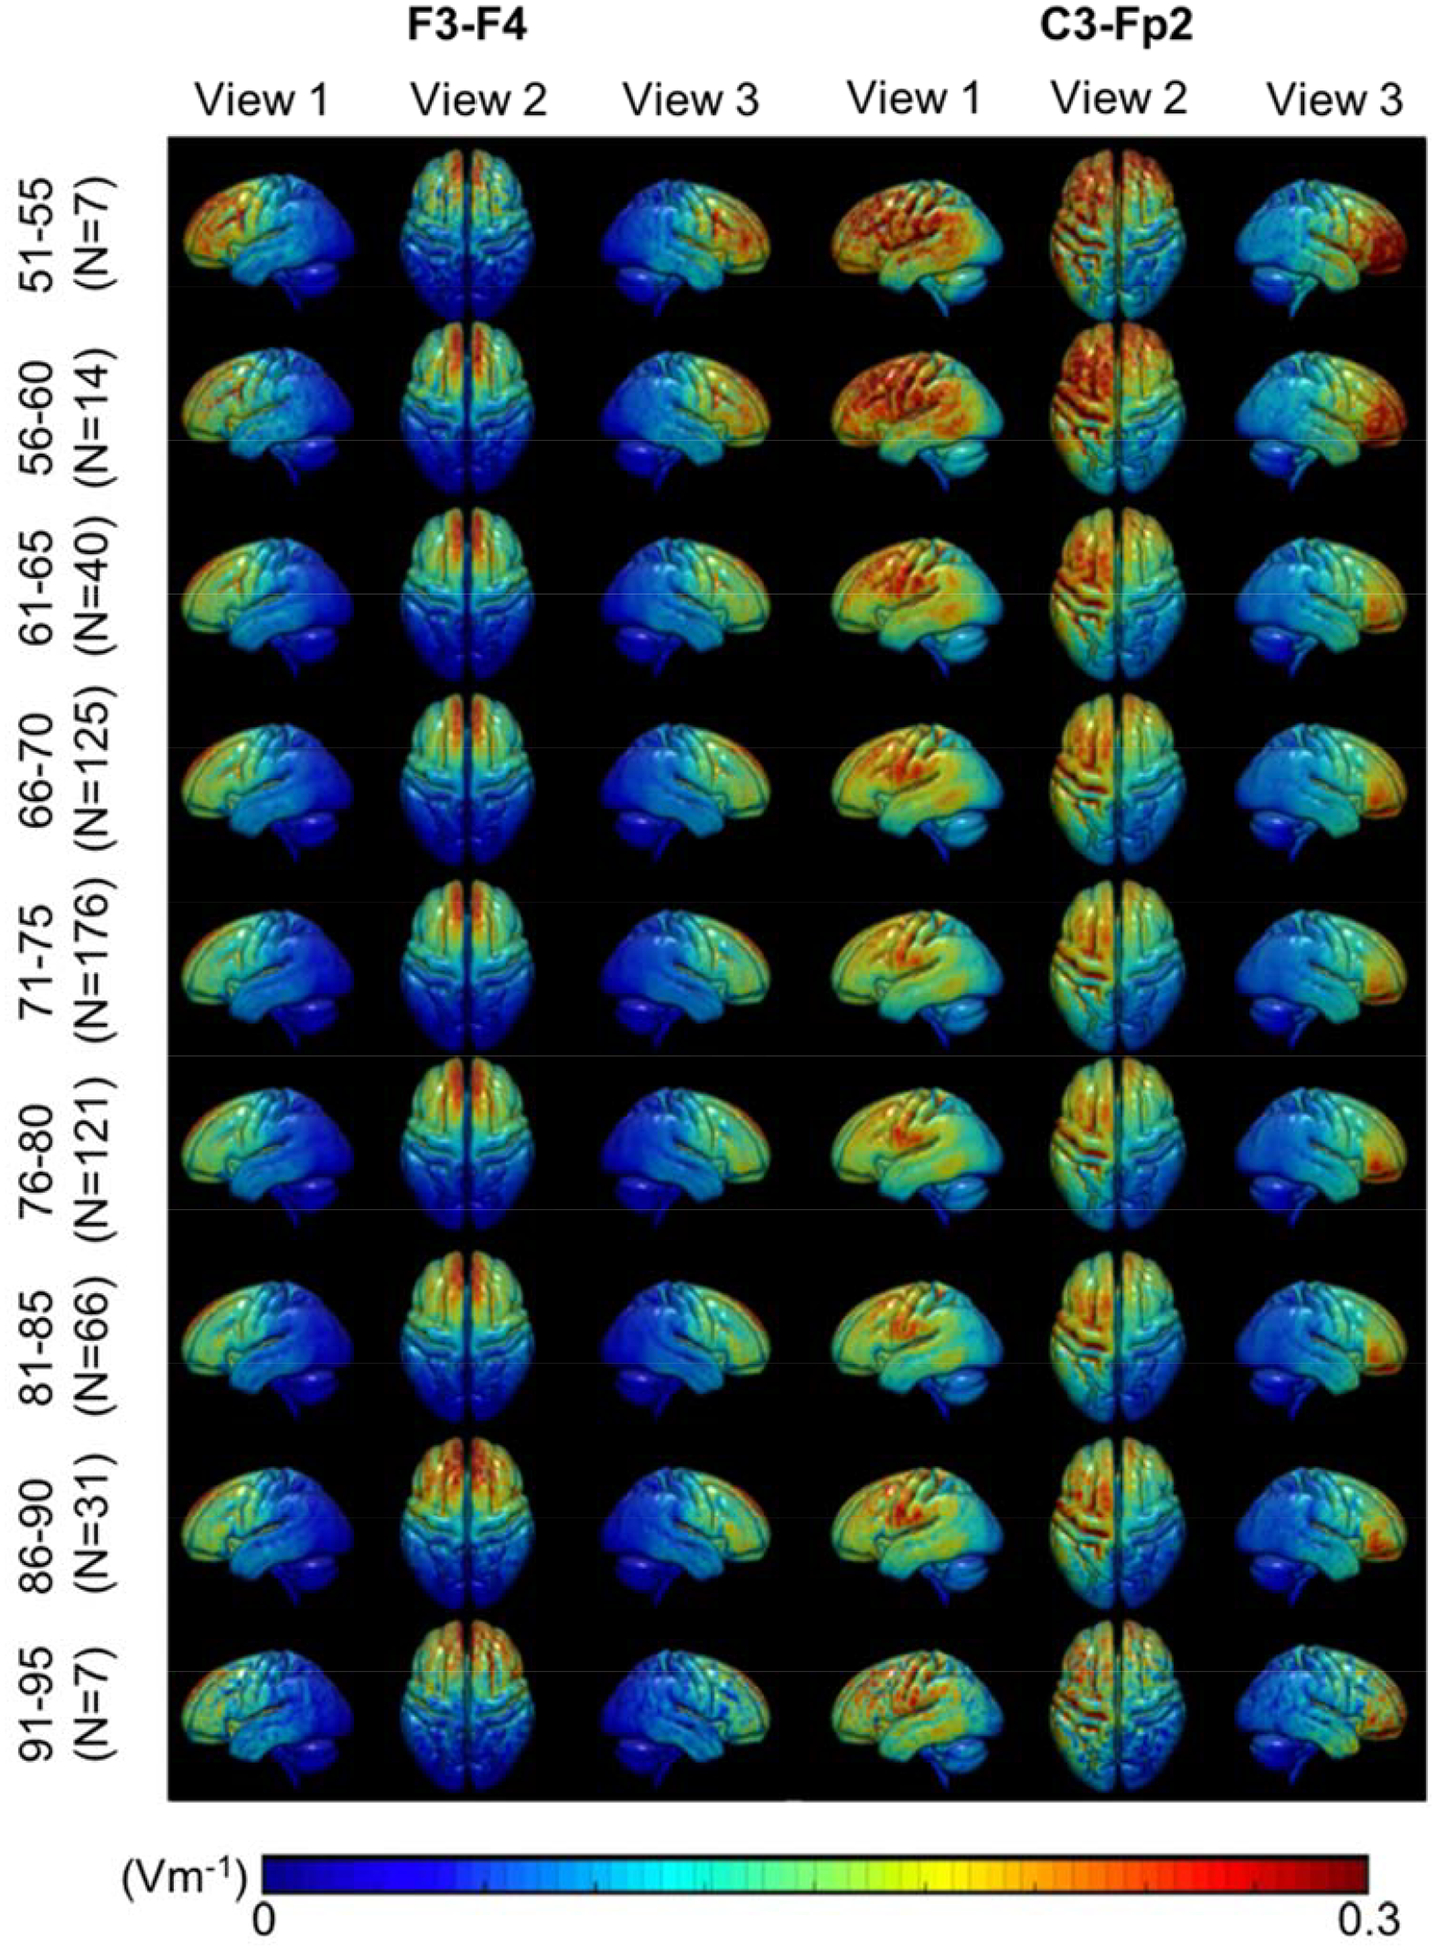
Figure 6.

Electric field strength (|EF|) heatmaps in F3-F4 and C3-Fp2 montage. Heatmaps of electric field strengths in the brain region (white and gray matter) shown in a typical scale reported in the literature. A decreasing trend in |EF| values, particularly in the brain region underneath the electrodes (the frontal lobe, the precentral and postcentral gyrus), is seen from the youngest (51–55) to oldest (91–95) cohort.
