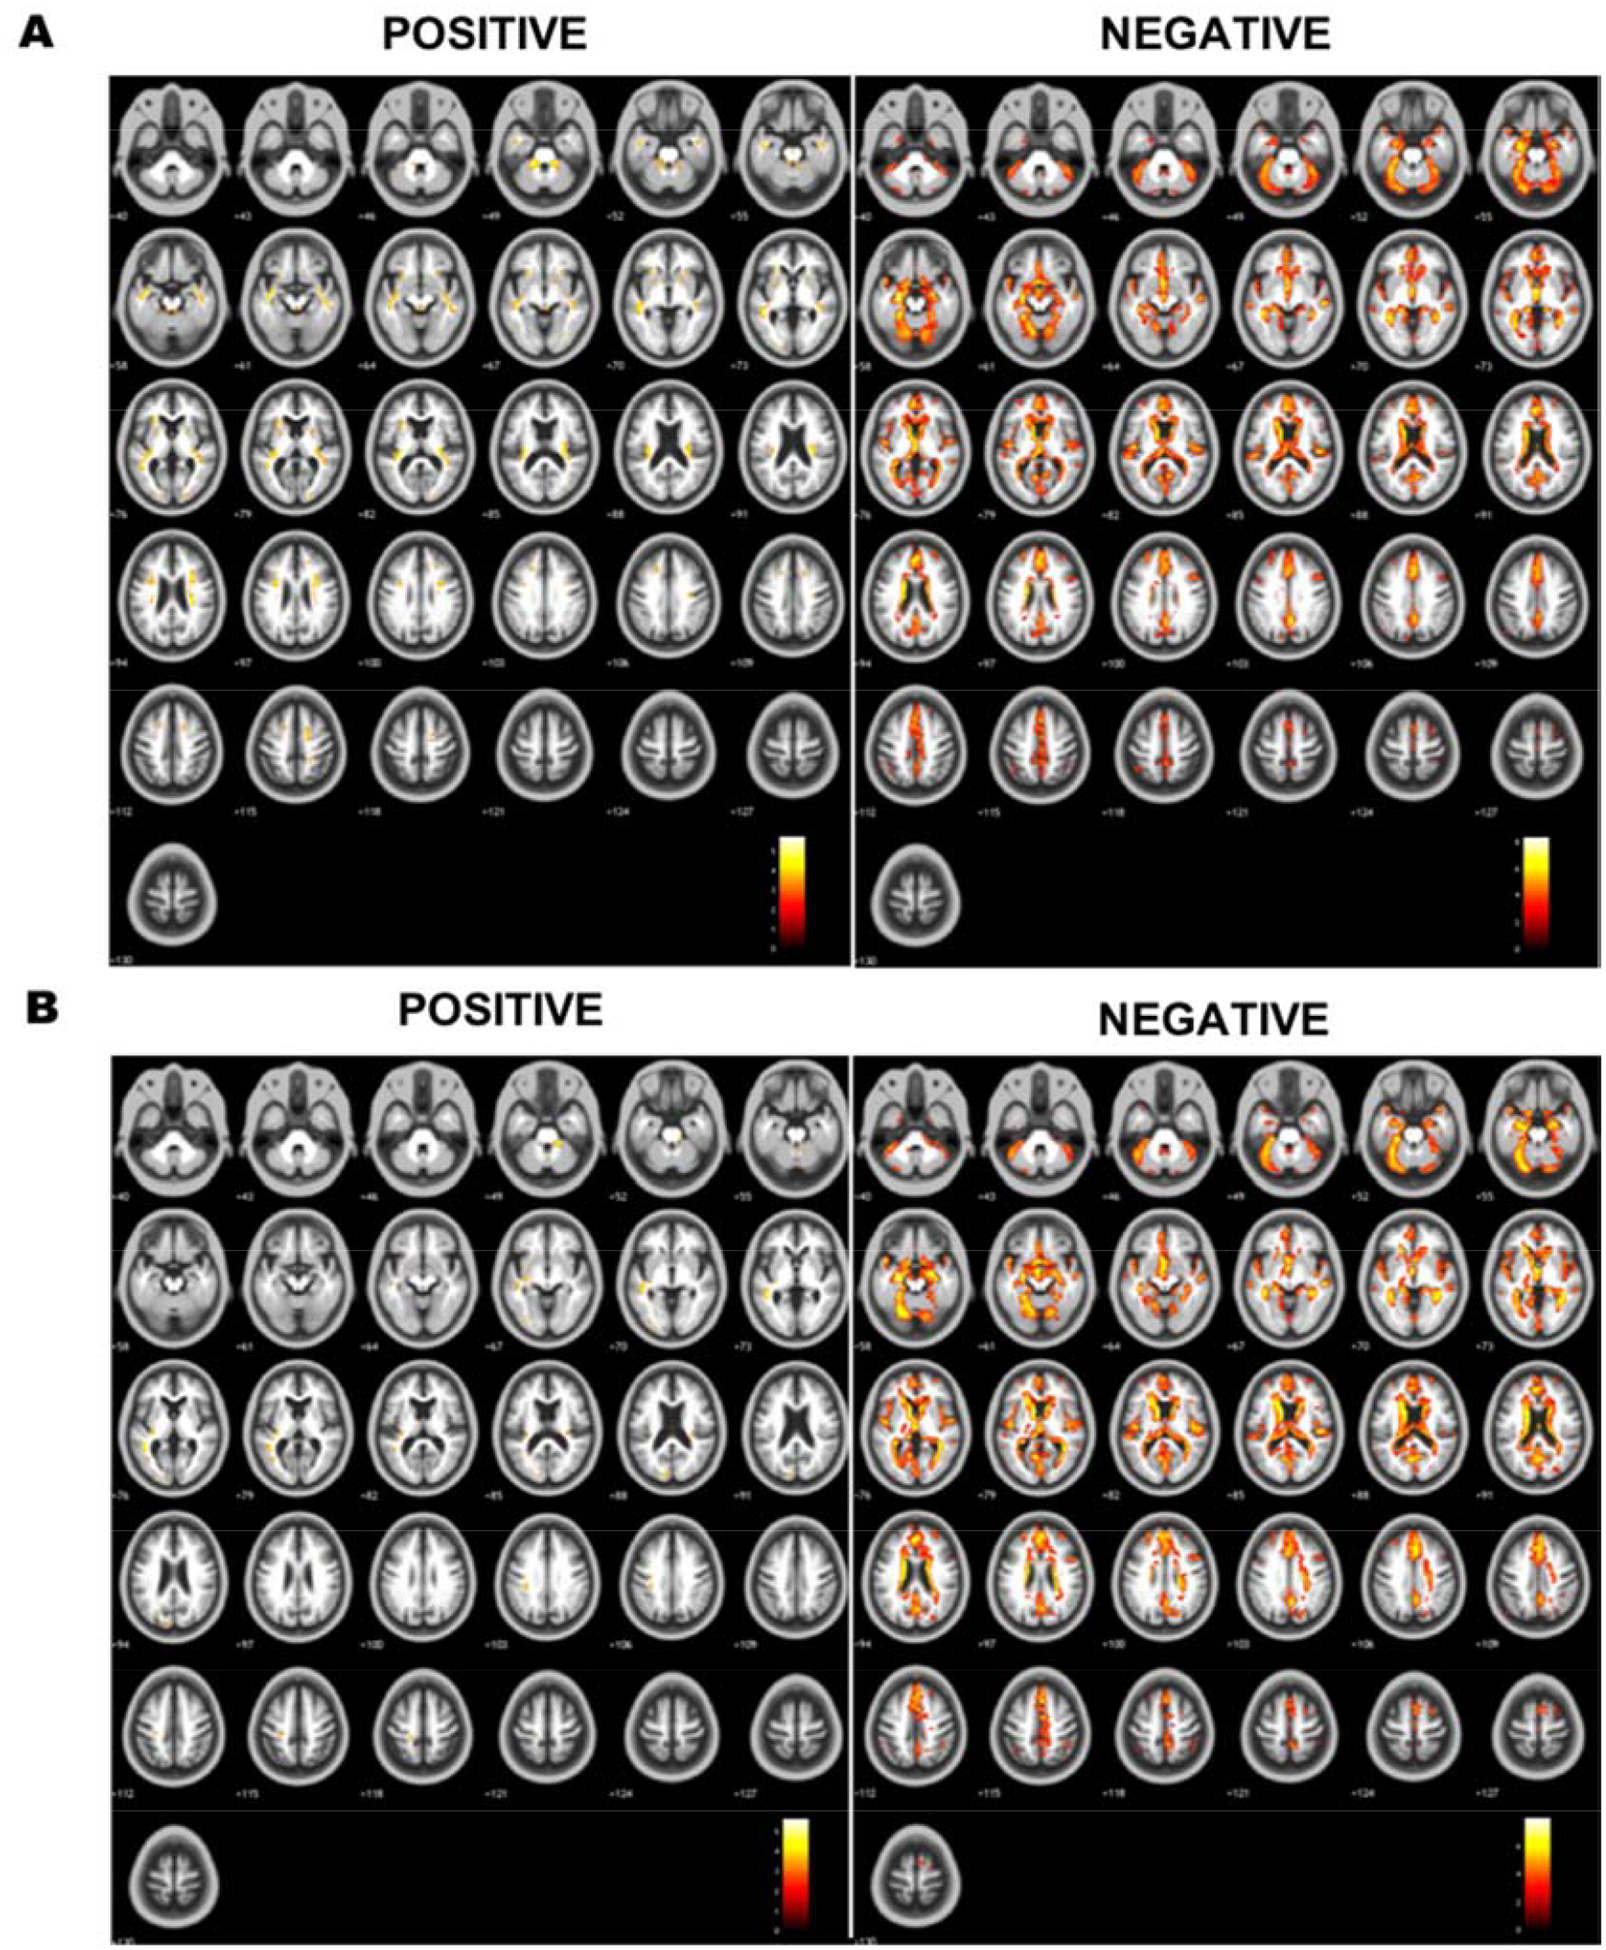
Figure 8.

Axial montages showing specific regions with significant positive and negative correlation between median current density (J) and age. Axial montages showing cluster location within the brain (brighter colors indicate larger significant values) for significant positive and negative correlation between age and median J in A) F3-F4 and B) C3-Fp2 (M1-SO) montage.
