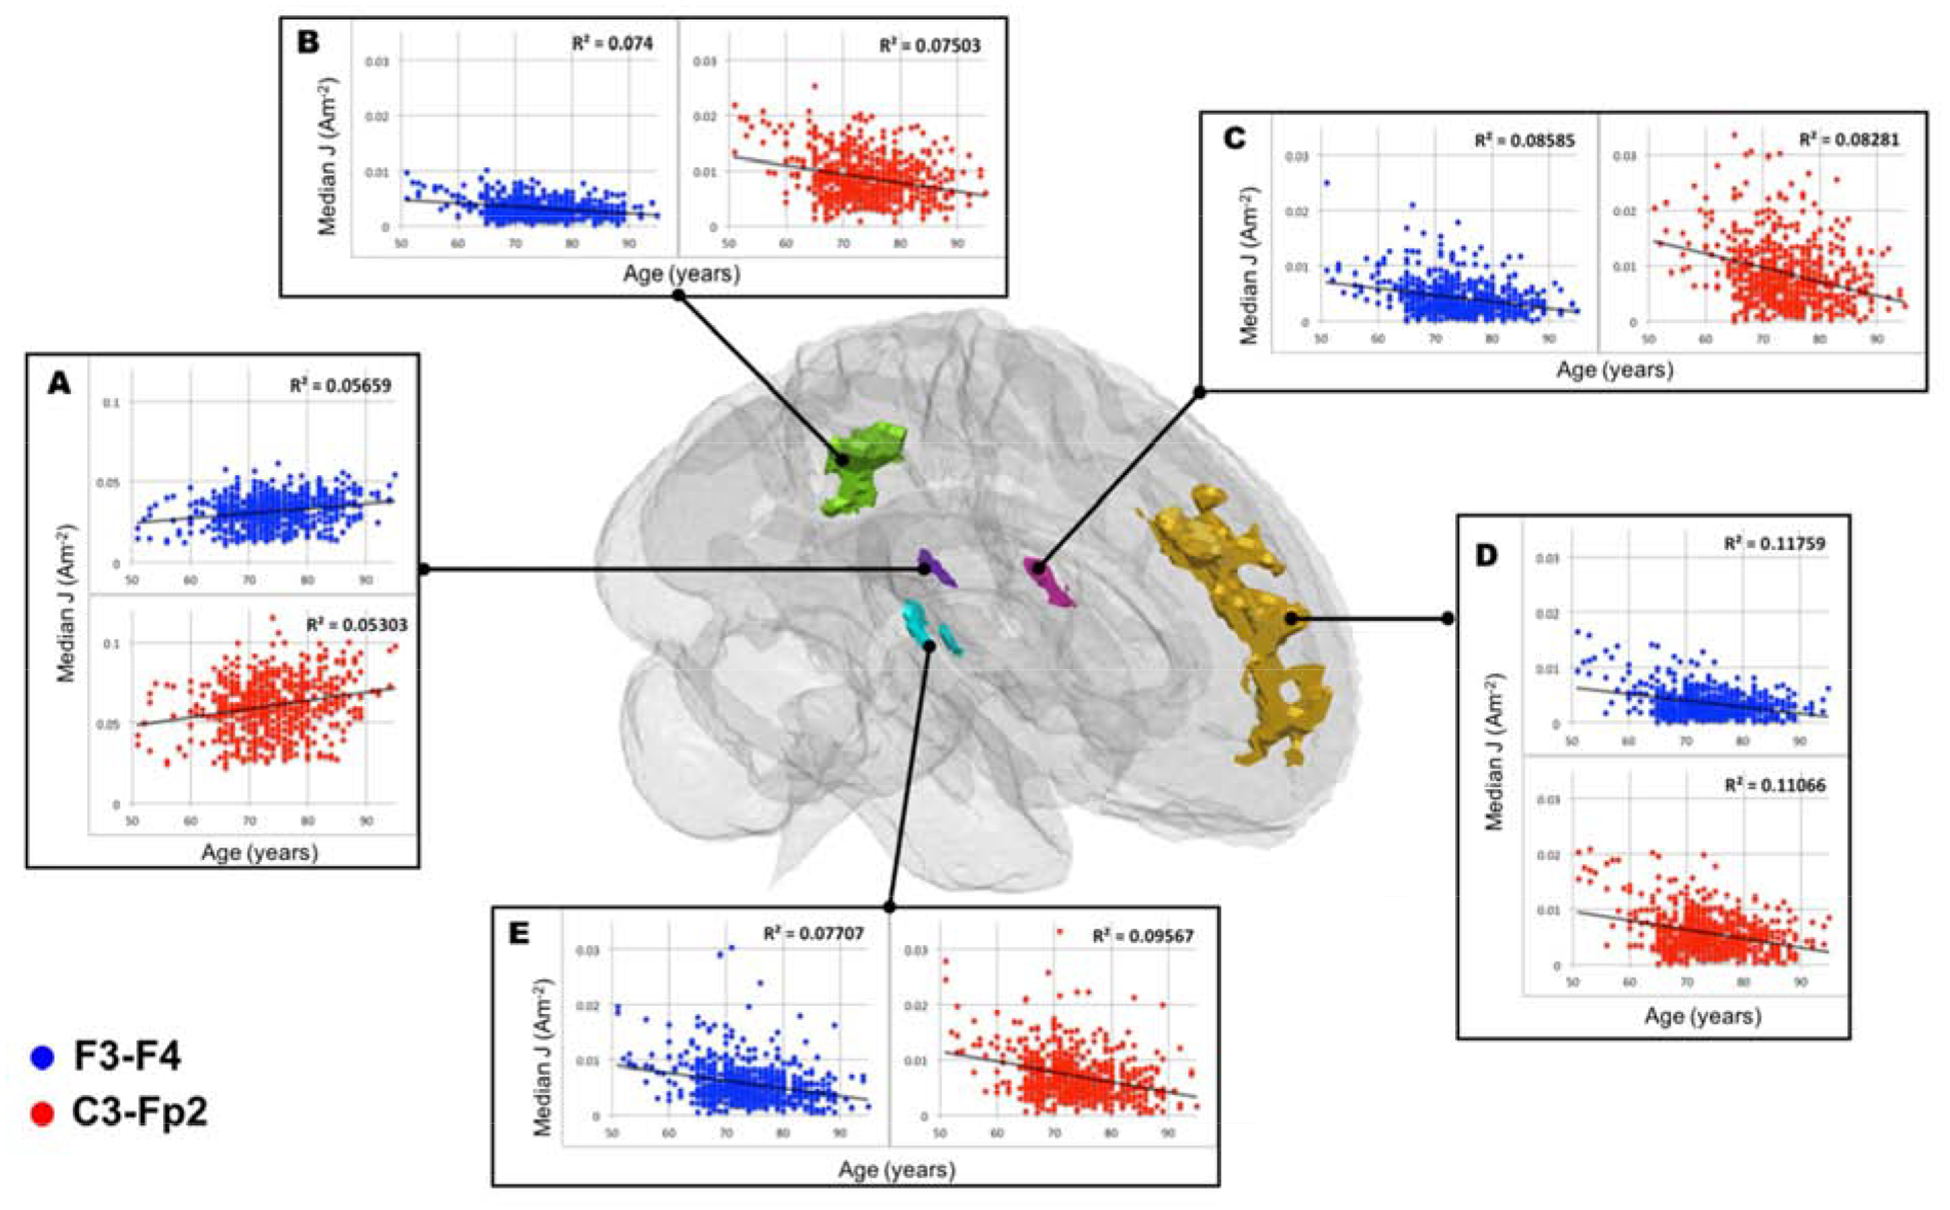
Figure 9.

Cluster specific scatter plots to illustrate current density (J) and age relationship. Blue and red markers are corresponded to F3-F4 and C3-Fp2 montage, respectively. Five selected clusters reported as significant at [x,y,z] location of A) [51, 86, 75] in Table 4, and B) [93, 72, 102] C) [50, 108, 82] D) [92, 162, 94] E) [136, 102, 86] in Table 5 were plotted as a representative of positive and negative correlation between median J and age.
