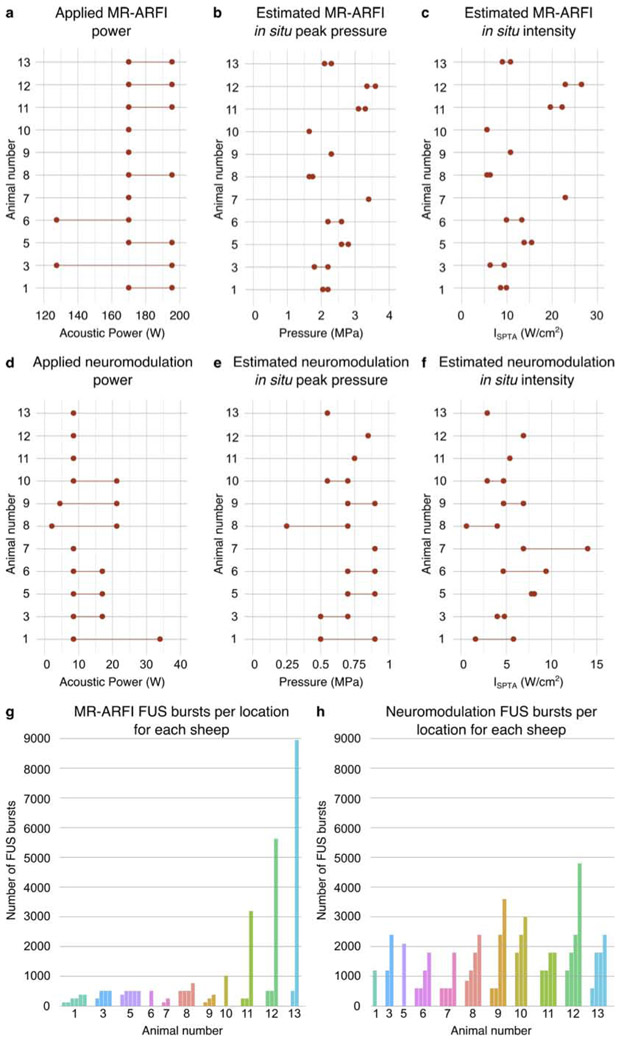
Figure 4.
In vivo sheep study parameters. (a,d) Range of applied acoustic powers and estimated in situ (b,e) peak pressure and (c,f) spatial peak temporal average intensity for MR-ARFI and neuromodulation, respectively. Total number of FUS bursts applied to each (g) MR-ARFI and (h) neuromodulation location, where animal number is reported below each bar cluster. Individual bars represent unique sonication locations, and bar height indicates number of FUS bursts delivered to that location.

