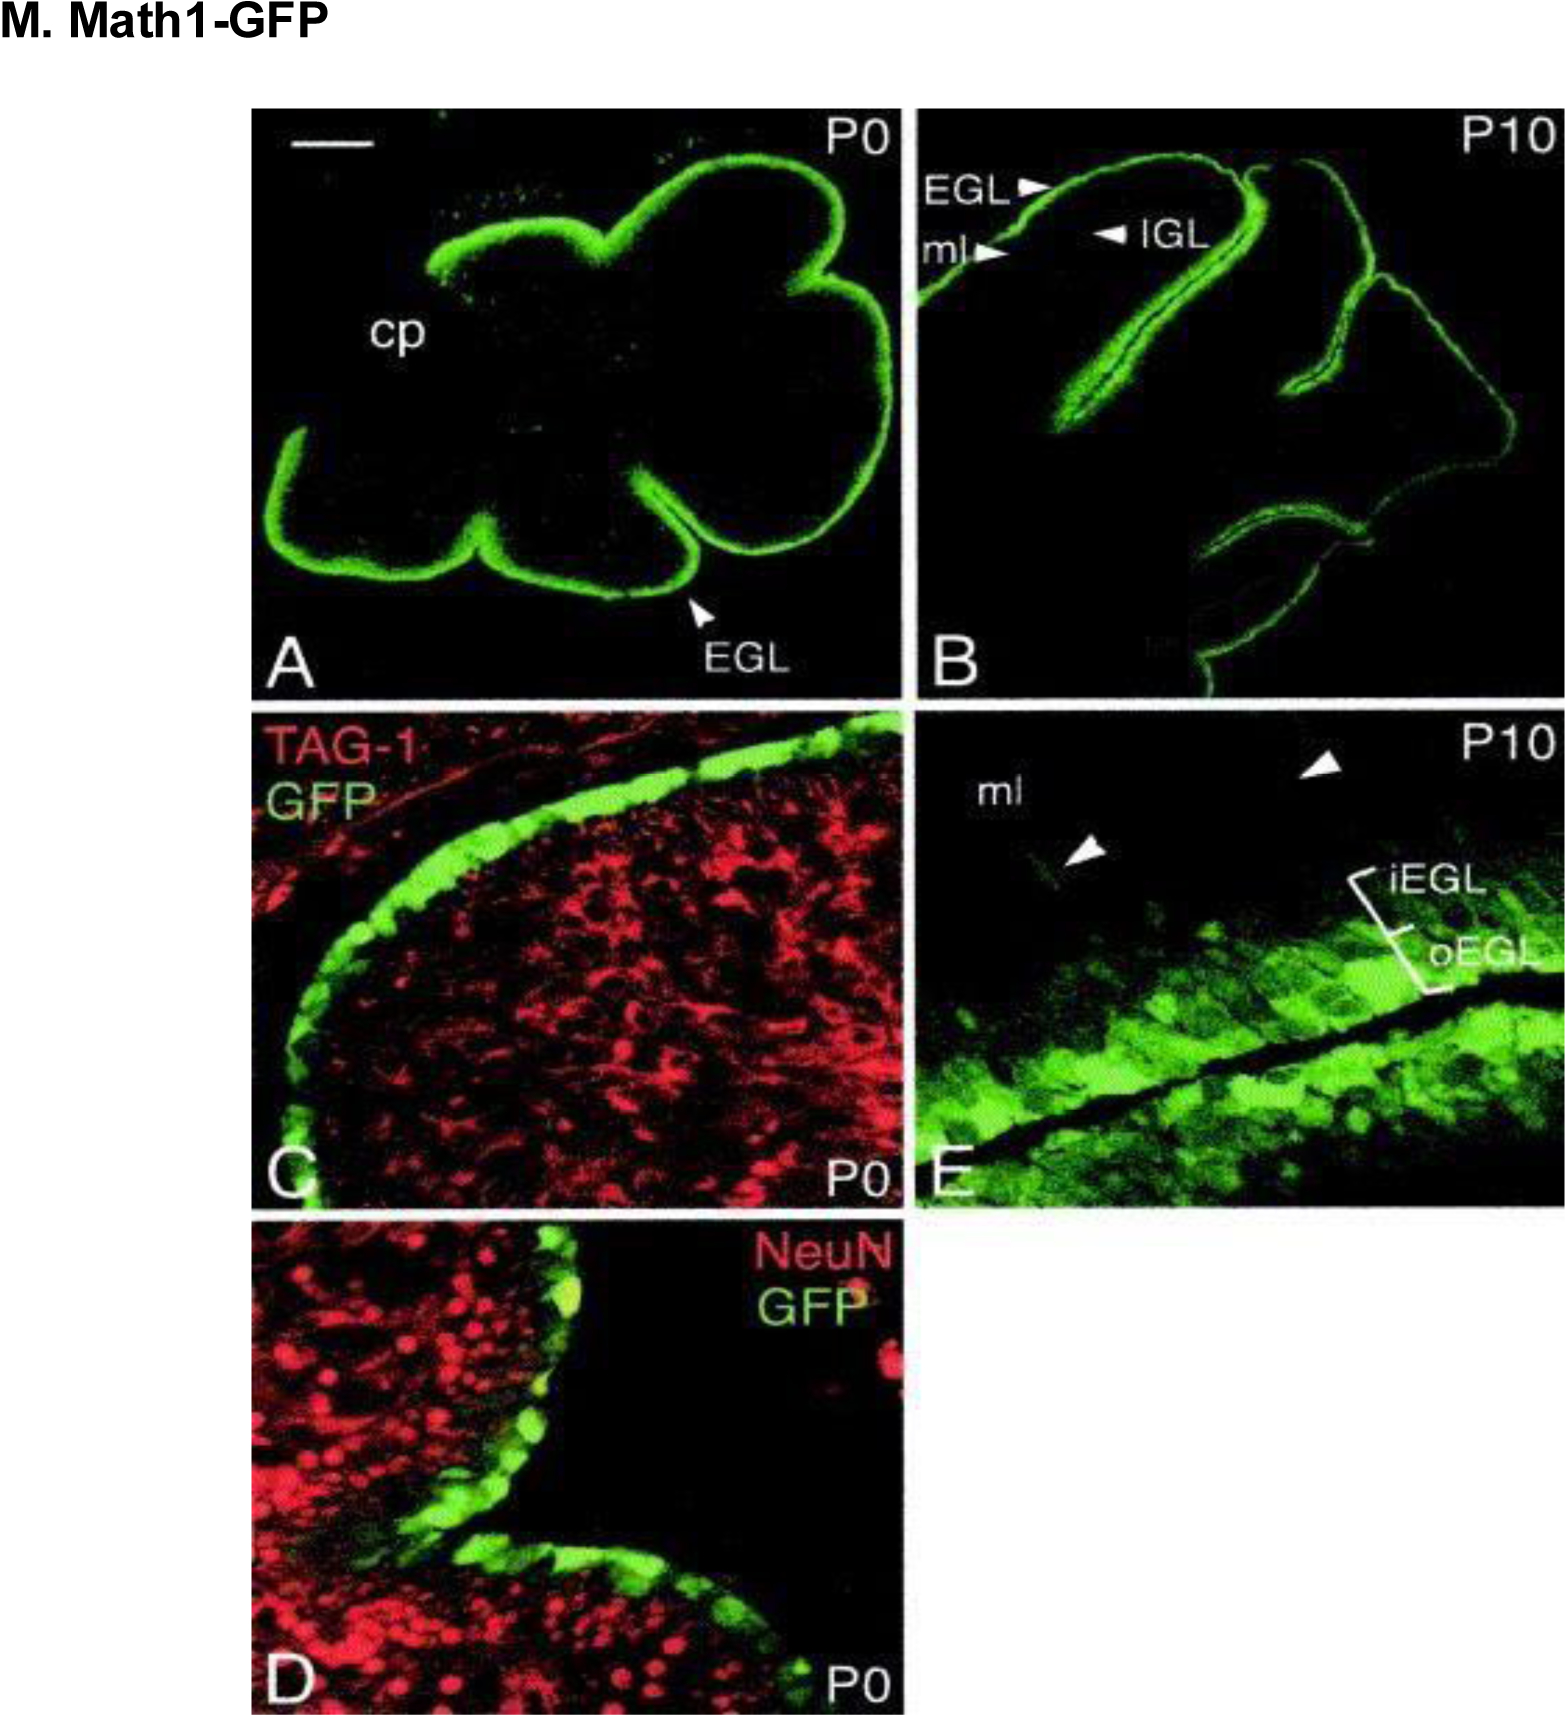
Figure 22.

Images of cerebellar granule cells on either P0 (A, C, D) or P10 (B, E). Math1-GFP expression was most prominent in the outer cerebellar EGL, which corresponds to normal expression of Math1. At P0, a lack of GFP expression overlap with markers of differentiating granule cells [TAG-1 and Neu-N in (C) and (D), respectively] was noted. (B) The majority of Math1-GFP–expressing cells were observed in the EGL, with minimal Math1-GFP expression in the IGL at P10. (E) Higher magnification images of the outer/inner EGL, with more intense Math1-GFP expression in the outer EGL; low Math1-GFP expression was also noted in the molecular layer (ml). Scale bars, (A) 150 μm; (B) 300 μm; (C-D) 25 μm; (E) 30 μm. Reproduced with permission from [222].
