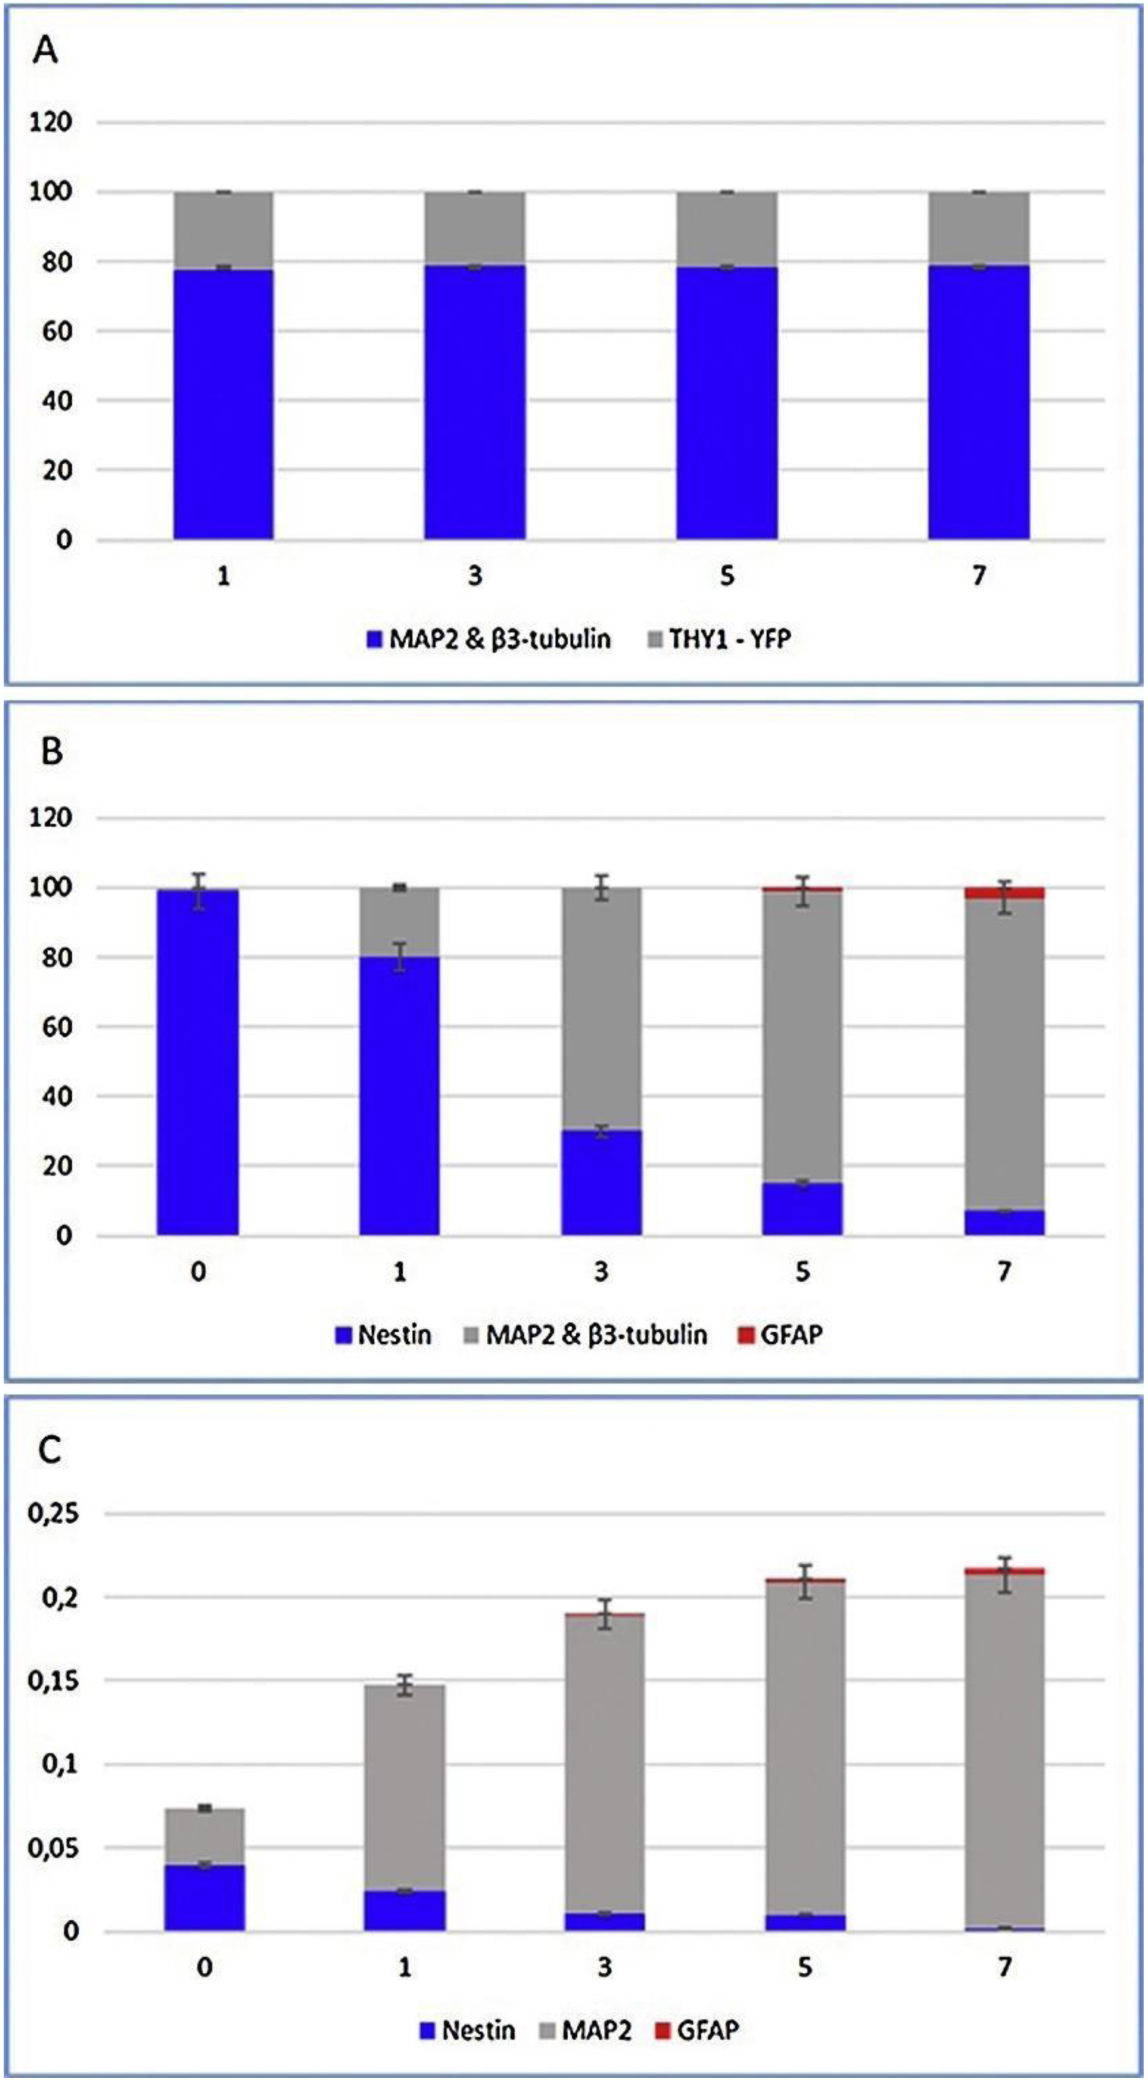
Figure 4.

Quantitative analyses of various cellular markers by immunocytochemistry (A–B) and RT-PCR (C). Notably, the percentage of cells expressing Nestin decreased from 99% to 7% during in vitro differentiation, because Nestin is preferentially expressed in undifferentiated neural progenitors. However, the expression of MAP2 and β3-tubulin conversely increased over time. Legend: x-axis – days in differentiation conditions; y-axis – number of counted cells (A), % of counted cells (B), and relative expression in RNA (C). Reproduced with permission from [27].
