FIGURE 1.

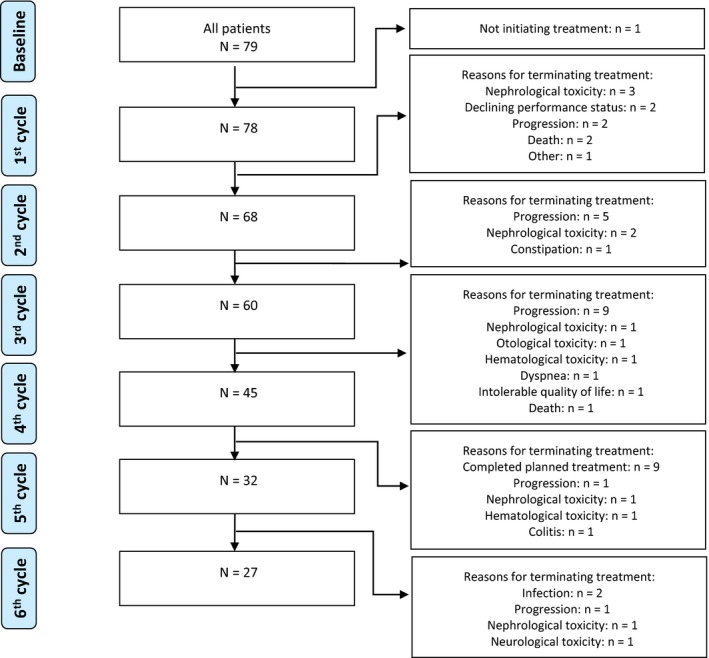
Consort diagram of the clinical course of patients in this study, N = 79. Explanations for treatment cessation is given in boxes on the right hand side, treatment cycles are illustrated on the left‐hand side

Consort diagram of the clinical course of patients in this study, N = 79. Explanations for treatment cessation is given in boxes on the right hand side, treatment cycles are illustrated on the left‐hand side