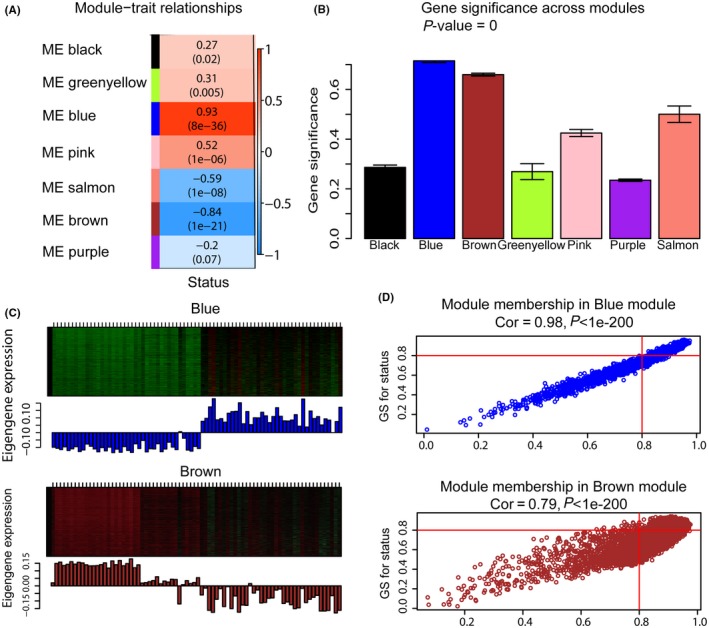
Figure 2.

Identification of hub modules associated with OSCC status. (A) Heatmap of the correlation between module eigengenes and OSCC status. Vertical axis represents modules, horizontal axis represents status. (B) Distribution of average GS in modules associated with OSCC status. (C) Heat maps and boxplots showing methylation status of CpG sites within the 2 hub modules. Hypermethylation is represented by red and hypomethylation by green in the heat maps. In the boxplot, the vertical axes represent the methylation ratio and the horizontal axes represent samples. (D) Scatter plot of GS vs MM in the brown module and blue module. Red cutoff lines for MM and GS at 0.8 indicate the criteria used to screen for hub CpG sites. GS, gene significance; MM, module membership; OSCC, oral squamous cell carcinoma
