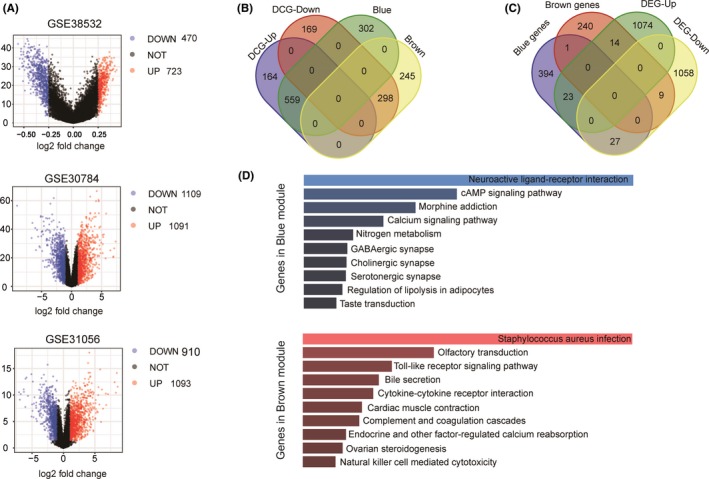
Figure 3.

Selection of hub methylated‐CpG sites and associated genes. (A) Volcano plot of DCGs and DEGs. Red dots represent upregulated genes, blue dots represent downregulated genes. (B) Venn diagrams of DCGs and genes in blue and brown modules. (C) Venn diagram of DEGs and DCG‐associated genes in blue and brown modules. (D) Functional analysis of DCG‐associated genes in blue and brown modules showed in boxplot. Top 10 enriched KEGG pathways are ranked by −log10 (P). DCGs, differentially methylated‐CpG sites; DEGs, differentially expressed genes; KEGG, Kyoto Encyclopedia of Genes and Genomes
