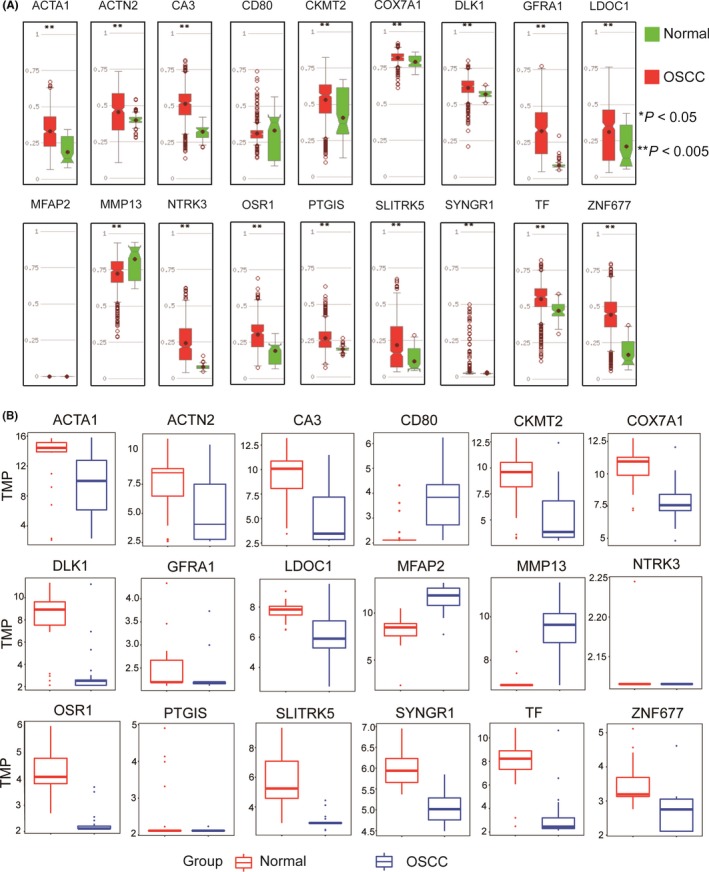
Figure 4.

Correlation analysis for selected hub genes between promoter methylation status and expression levels. (A) Boxplots showing promoter methylation status of 18 hub genes, analyzed via MethHC. (B) Boxplots showing expression levels of 18 hub genes from http://www.ncbi.nlm.nih.gov/geo/query/acc.cgi?acc=GSE31056. Normal samples (n = 45) are shown as red box and dots and OSCC samples (n = 167) as blue box and dots. OSCC, oral squamous cell carcinoma
