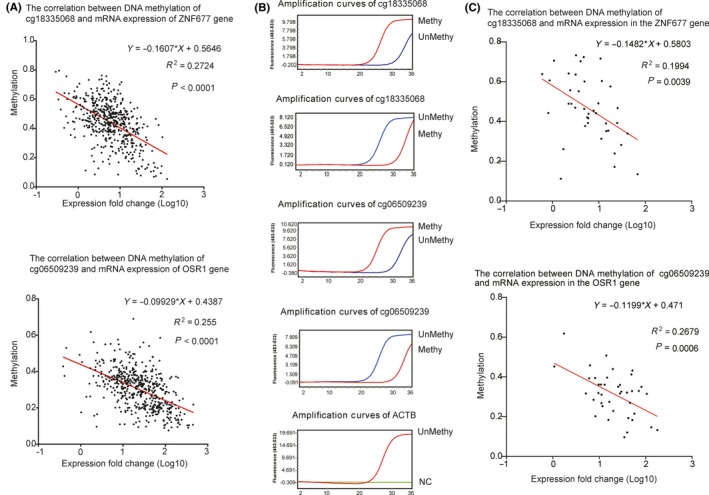
Figure 7.

Linear correlation analysis of selected hub CpG sites and mRNA expression levels in MethHC and clinical samples by Pearson's correlation analysis. (A) Linear correlation scatterplot of hub CpG sites in MethHC. X‐axis represents mRNA expression fold change (Log10). Y‐axis represents methylation ratio. (B) QMSP for the identification of methylation status of CpG sites using 40 OSCC samples from the hospital. Methy represents MehthyPrimer and UnMethy represents UnMethyPrimer. NC means negative control (using ddH2O instead of ACTB primers). (C) Linear correlation scatterplot of hub CpG sites using 40 OSCC samples. Real‐time PCR was used to determine mRNA levels of ZNF677 and OSR1 in 40 OSCC samples from the hospital. X‐axis represents mRNA expression fold change (Log10). Y‐axis represents methylation ratio. P < .05 is statistical significance. Red line indicates the tendency of scatterplot. R 2 is correlation coefficient. Equation is linear regression equation. OSCC, oral squamous cell carcinoma; QMSP, quantitative methylation‐specific PCR
