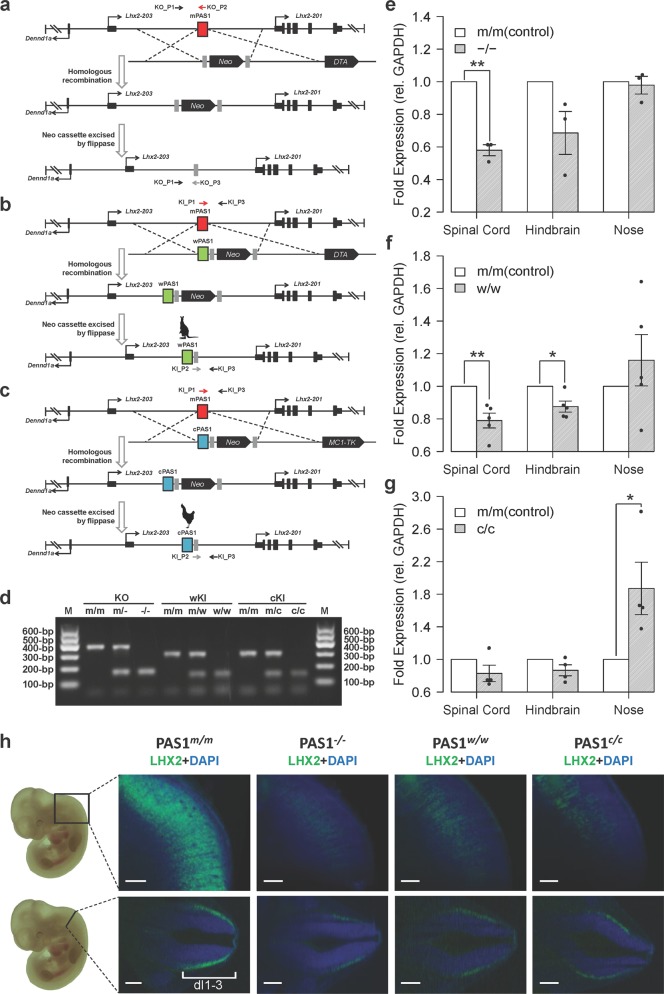
Fig. 3. Effect of PAS1s from various amniotes on the expression of Lhx2 in embryonic nervous system.
a–c Generation of PAS1−, PAS1w and PAS1c mice. Either pGK-Neo/DTA or pGK-Neo/Mc1-TK selection cassette was used. d PCR genotyping of wild-type (PAS1m) and mutant (PAS1−, PAS1w and PAS1c) mice. e–g Expression of Lhx2, determined by RT-qPCR, in spinal cord, hindbrain, and nose of E11.5 PAS1−/−, PAS1w/w, and PAS1c/c. Fold expression of Lhx2 is relative to the control (wild-type littermates PAS1m/m). Error bars represent the SEM of at least three biological replicates with three technical replicates for each experiment. One-tailed Student’s t-test, *P < 0.05, **P < 0.01. h Spinal cord of E11.5 wild-type, PAS1−/−, PAS1w/w, and PAS1c/c embryos after CUBIC clearing and LHX2 immunostaining (green). Wild-type littermates (PAS1m/m) were used as the control, and only one littermate was shown. LHX2 protein levels are decreased significantly, and the expression region is distant from the dorsal spinal cord in PAS1−/−, PAS1w/w, and PAS1c/c mice, compared with the control. The region with Lhx2 expression in the wild-type embryo is marked (dI1-3, three neuronal cell types).80 One representative of each genotype is shown. All embryos (n ≥ 3 per genotype) are shown in Supplementary information, Fig. S8. Scale bar, 200 μm.

