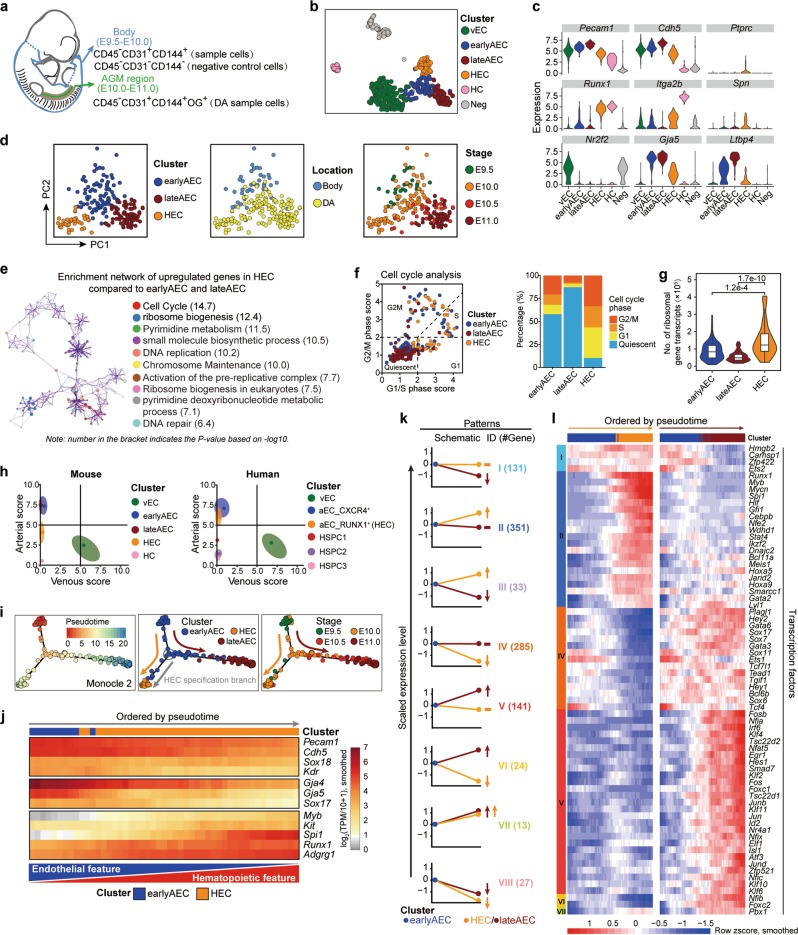
Fig. 1. Transcriptomic identification and molecular characteristics of the HECs in the AGM region.
a Schematic illustration of the strategies used for embryo dissection and cell preparation for the subsequent scRNA-seq. The involved body part and the AGM region is indicated as blue and green, respectively, with head, limb buds, heart, visceral bud, and umbilical and vitelline vessels outside the embryo proper excluded. b t-SNE plots with clusters mapped onto it. c Violin plots showing the expression levels of indicated genes in six clusters identified in the initial dataset. d PCA plots with three clusters (earlyAEC, lateAEC and HEC) (left), sampling locations (middle) and embryonic stages (right) mapped onto it. e Metascape network enrichment analysis with top 10 enriched terms exhibited on the right. Each cluster is represented by different colors and each enriched term is represented by a circle node. Number in the bracket indicates the P value based on −log10. f Classification of the indicated cells into quiescent phase and other cycling phases (G1, S and G2M) based on the average expression of G1/S and G2/M gene sets (left). Stacked bar chart showing the constitution of different cell cycle phases in the three corresponding clusters shown on the left (right). g Violin plot showing the number of transcripts for ribosome-related genes detected in each single cell of the indicated clusters. Wilcoxon Rank Sum test is employed to test the significance of difference and P values are indicated for the comparison. P < 0.05 is considered statistically significant. h Scatterplot showing the average arteriovenous scores of the cells in each cluster for mouse dataset in this paper (left) and human dataset from a published article19 (right), respectively. Main distribution ranges of arteriovenous scores in each cluster are also indicated as an oval shape. i Pseudotemporal ordering of the cells in three selected clusters inferred by monocle 2, with pseudotime (left), clusters (middle) and sampling stages (right) mapped to it. HEC specification and AEC maturation directions are indicated as orange and deep red arrows, respectively. j Heatmap showing the expression of the indicated genes (smoothed over 15 adjacent cells) with cells ordered along the pseudotime axis of HEC specification branch inferred by monocle 2. k Eight major expression patterns identified from the differentially expressed genes in HEC or lateAEC as compared to earlyAEC. Arrows showing the changes in HEC or lateAEC as compared to earlyAEC. The numbers of pattern genes are indicated on the right. l Heatmaps showing the relative expressions (smoothed over 20 adjacent cells) of the TFs belonging to the pattern genes with cells ordered along the pseudotime axis and genes ordered by patterns.

