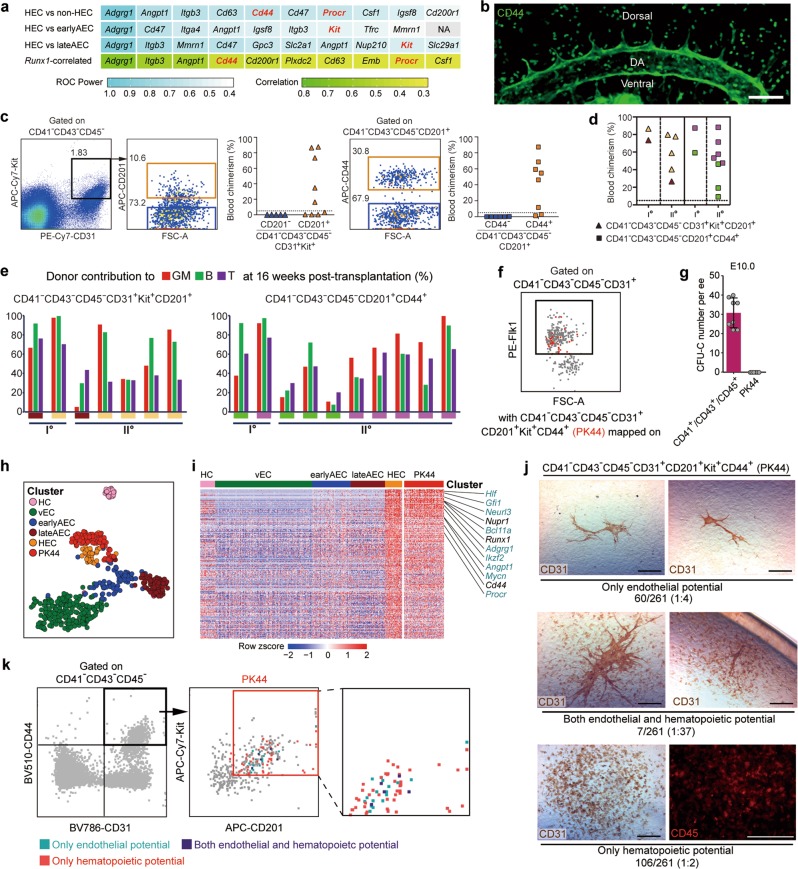
Fig. 2. Efficient isolation of the HSC-competent and endothelial-hematopoietic dual-potent HECs before HSC emergence.
a Gene lists of the top ten cell surface molecules significantly overrepresented in HEC as compared to the indicated cell populations (first 3 lines) and those positively correlated with Runx1 within 4 EC clusters (vEC, earlyAEC, lateAEC and HEC, last line). Non-HEC, cells except for HEC within 4 EC clusters. Highlights in red font indicate the candidates used for further functional analysis. b Representative whole-mount staining of CD44 at E10.0 AGM region, showing CD44 is expressed in the whole endothelial layer of the dorsal aorta and roots of its proximal branches. DA, dorsal aorta; Scale bar, 100 μm. c Representative FACS plots for cell sorting of the E9.5-E10.0 caudal half for co-culture/transplantation assay and the donor chimerism at 16 weeks after transplantation of the derivatives of the indicated cell populations. d Blood chimerism of the primary (Io) and corresponding secondary (IIo) recipients at 16 weeks post-transplantation. The primary recipients were transplanted with the derivatives of the indicated cells from the caudal half of E9.5-E10.0 embryos. The paired primary and corresponding secondary repopulated mice are shown as the same symbol and color. e Bars represent the percent donor contribution to the granulocytes/monocytes (GM, red), B lymphocytes (green), and T lymphocytes (purple) in the peripheral blood of the primary (I°) and secondary (II°) recipients at 16 weeks post-transplantation. The paired primary and corresponding secondary repopulated mice are shown as the same colors below. f FACS plot of Flk1 expression in the indicated population of E10.0 AGM region, with PK44 (CD41−CD43−CD45−CD31+CD201+Kit+CD44+) cells (red) mapped onto it. Box indicates the gate of Flk1+ cells. g Number of hematopoietic progenitors per embryo equivalent (ee) in the indicated populations derived from E10.0 caudal half measured by the methylcellulose colony forming unit-culture (CFU-C) assay. Data are means ± SD. Data are from 4 independent experiments. h t-SNE plot of the cells included in the filtered initial dataset and PK44 dataset, with clusters mapped on it. PK44, CD41−CD43−CD45−CD31+CD201+Kit+CD44+ population from E10.0 AGM region. i Heatmap showing the relative expressions of HEC feature genes, which are defined as those significantly highly expressed as compared to others including HC, vEC, earlyAEC and lateAEC, in the indicated cell populations. Selected HEC feature genes are shown on the right with pre-HSC signature genes marked as aquamarine. j Representative CD31 and CD45 immunostaining on the cultures of single PK44 cells from E10.0 AGM region, showing typical morphologies regarding distinct differentiation potentials. Cell frequencies of each kind of potential are also shown. Data are from 5 independent experiments with totally 15 embryos used. Scale bars, 400 μm. k Expression of Kit and CD201 in the index-sorted single PK44 cells with differentiation potential based on in vitro functional evaluation. Cells with different kinds of potentials are mapped onto the reference FACS plots (gray dots). Box in the middle plot indicates the gate for FACS sorting of PK44 cells in E10.0 AGM region and its enlarged view is shown on the right.

