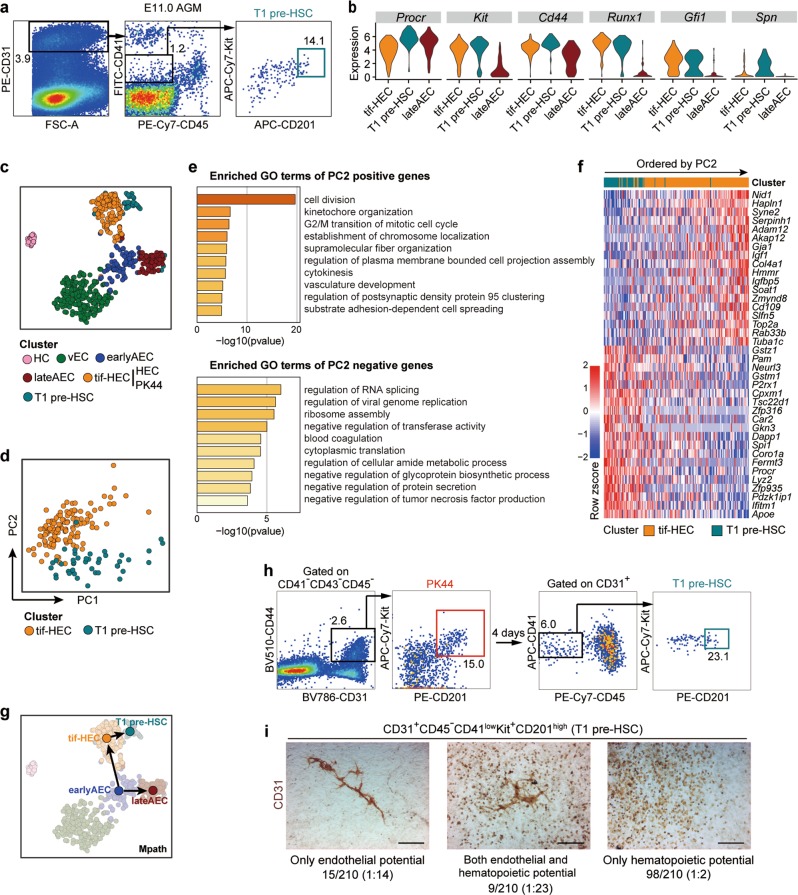
Fig. 3. Relationship between HSC-primed HECs and T1 pre-HSCs.
a Representative FACS plots for sorting of the T1 pre-HSCs (CD31+CD45−CD41lowKit+CD201high) from E11.0 AGM region of mouse embryos for the subsequent scRNA-seq. b Violin plots showing the expression levels of indicated genes in tif-HEC (including clusters HEC and PK44), T1 pre-HSC and lateAEC. c t-SNE plot of the cells included in the filtered initial dataset, PK44 dataset and T1 pre-HSC dataset, with clusters mapped on it. Clusters HEC and PK44 are combined as tif-HEC. d PCA plot of tif-HEC and T1 pre-HSC populations. e. Enriched terms of PC2-positive and -negative genes are shown, corresponding to the properties distinguishing tif-HEC and T1 pre-HSC, respectively. f Heatmap showing top 20 positive and negative genes of PC2. Genes are ordered by their contributions to PC2. g Trajectory of AEC clusters, tif-HEC and T1 pre-HSC inferred by Mpath. Arrows indicate the development directions predicted by sampling stages. h Representative FACS plots for sorting of the PK44 cells from E10.0 AGM region (left) and analysis of the immunophenotypic T1 pre-HSCs (right) after cultured in vitro for 4 days. i Representative CD31 immunostaining on the cultures of single T1 pre-HSCs from E11.0 AGM region, showing typical morphologies regarding distinct differentiation capacities. Cell frequencies of each type are also shown. Data are from 7 independent experiments with totally 89 embryos used. Scale bars, 400 μm.

