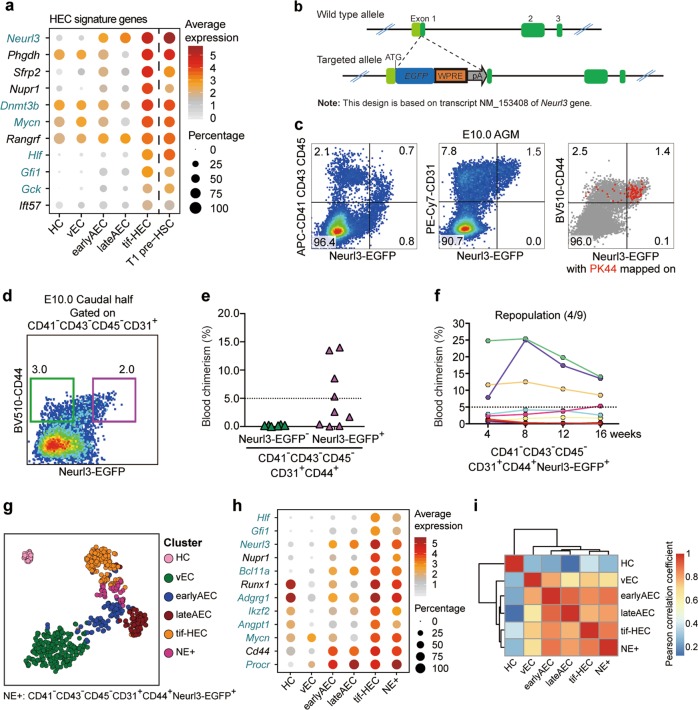
Fig. 4. Identifying Neurl3 as a signature gene of HSC-primed HECs validated by functional and transcriptomic evaluation.
a Dot plot showing the average and percentage expression of HEC signature genes in the indicated clusters. Genes are ordered by their median expression level in tif-HEC. Pre-HSC signature genes are marked as aquamarine. b Schematic model of the gene-targeting strategy for generating Neurl3EGFP/+ reporter mouse line via CRISPR/Cas9 system. c Representative FACS analysis of the E10.0 AGM region in Neurl3EGFP/+ embryos. FACS plot on the right shows PK44 cells (red dots) mapped on it. d Representative FACS plot for sorting of the indicated cell populations from E10.0 caudal half of Neurl3EGFP/+ embryos for the subsequent co-culture and transplantation assay. e Graph showing the donor chimerism at 16 weeks after transplantation of the derivatives of the indicated populations from the caudal half of E10.0 Neurl3EGFP/+ embryos. f Graph showing the donor chimerism at 4–16 weeks post-transplantation. The recipients were transplanted with the derivatives of CD41−CD43−CD45−CD31+CD44+Neurl3-EGFP+ population from the caudal half of E10.0 Neurl3EGFP/+ embryos. Number of repopulated/total recipients is shown in the brackets. g t-SNE plot of the cells included in the filtered initial dataset and additional PK44 and NE+ datasets, with clusters mapped on it. The HEC and PK44 clusters are combined as tif-HEC. NE+, CD41−CD43−CD45−CD31+CD44+Neurl3-EGFP+ population from E10.0 AGM region. h Dot plot showing the average and percentage expression of selected HEC feature genes in the indicated clusters. Pre-HSC signature genes are marked as aquamarine. i Heatmap showing the correlation coefficient between each two clusters with hierarchical clustering using average method. Pearson correlation coefficient is calculated using average expression of highly variable genes in each cluster.

