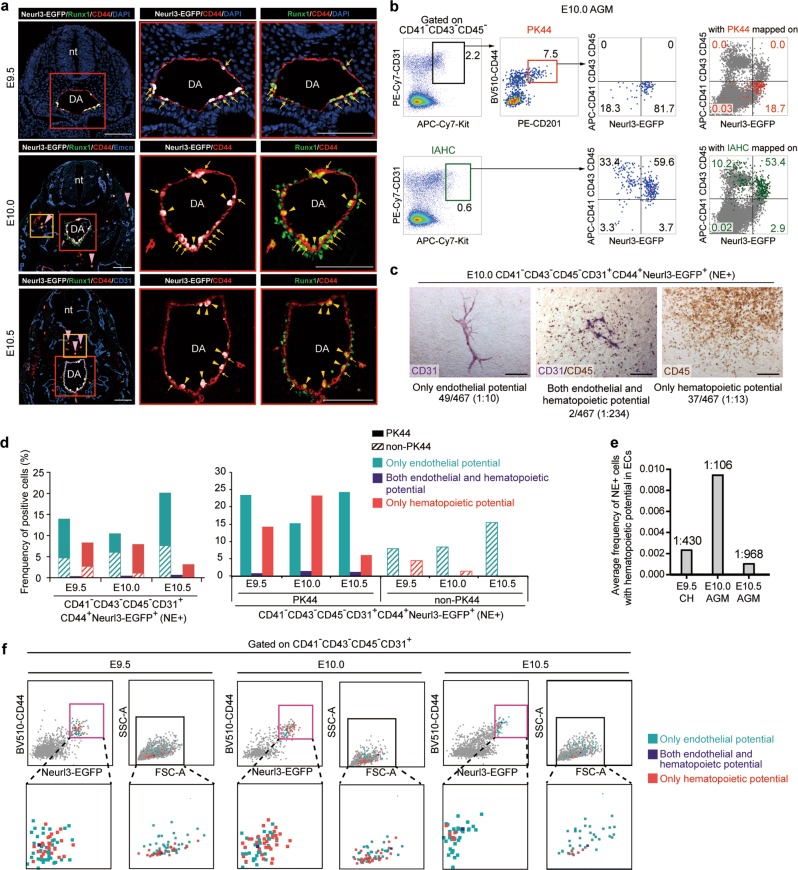
Fig. 5. In situ localization and in vitro function of the dynamic HECs marked by Neurl3-EGFP reporter.
a Representative immunostaining on cross sections at the AGM region of E9.5 (upper), E10.0 (middle) and E10.5 (lower) Neurl3EGFP/+ embryos. Arrows indicate Neurl3-EGFP+ aortic ECs. Yellow arrowheads indicate Neurl3-EGFP+ bulging and bulged cells and also IAHCs. White pink arrowheads indicate CD44+Runx1+Neurl3− hematopoietic cells distributed outside the aorta. The high magnification views of yellow boxes are shown in Supplemental information, Fig. S3g. nt, neural tube; DA, dorsal aorta. Scale bars, 100 μm. b Representative FACS analysis of the E10.0 AGM region of Neurl3EGFP/+ embryos. FACS plots on the right showing PK44 cells (red dots, upper) and IAHC (CD31+Kithigh) cells (green dots, lower) mapped on, respectively, with their contributions to the population in each gated quadrant indicated. c Representative CD31 and CD45 immunostaining on the cultures of single NE+ (CD41−CD43−CD45−CD31+CD44+Neurl3-EGFP+) cells from E10.0 AGM region of Neurl3EGFP/+ embryos, showing typical morphologies regarding distinct differentiation potentials. Cell frequencies of each kind of potential are also shown. Data are from 5 independent experiments with totally 37 embryos used. Scale bars, 400 μm. d Column charts showing the frequencies of positive cells in the indicated populations (lower) for each kind of potential. The experiments were performed with NE+ (CD41−CD43−CD45−CD31+CD44+Neurl3-EGFP+) single cells from E9.5 caudal half or E10.0-E10.5 AGM region of Neurl3EGFP/+ embryos with PK44 indexed. Progenies from PK44 and non-PK44 fractions within NE+ cells are represented by distinct fill patterns. e Graph showing the average frequencies of the NE+ (CD41−CD43−CD45−CD31+CD44+Neurl3-EGFP+) cells with hematopoietic potential in ECs (CD41−CD43−CD45−CD31+) in E9.5 caudal half (CH) or E10.0–E10.5 AGM region of Neurl3EGFP/+ embryos. f Expression of CD44 and Neurl3-EGFP and values of FSC-A and SSC-A in the index-sorted single NE+ (CD41−CD43−CD45−CD31+CD44+Neurl3-EGFP+) cells with differentiation potential based on in vitro functional evaluation. Cells with different kinds of potentials are mapped onto the reference FACS plots (gray dots). Pink boxes indicate the gates of the populations for FACS sorting. The enlarged views of solid boxes are shown below.

