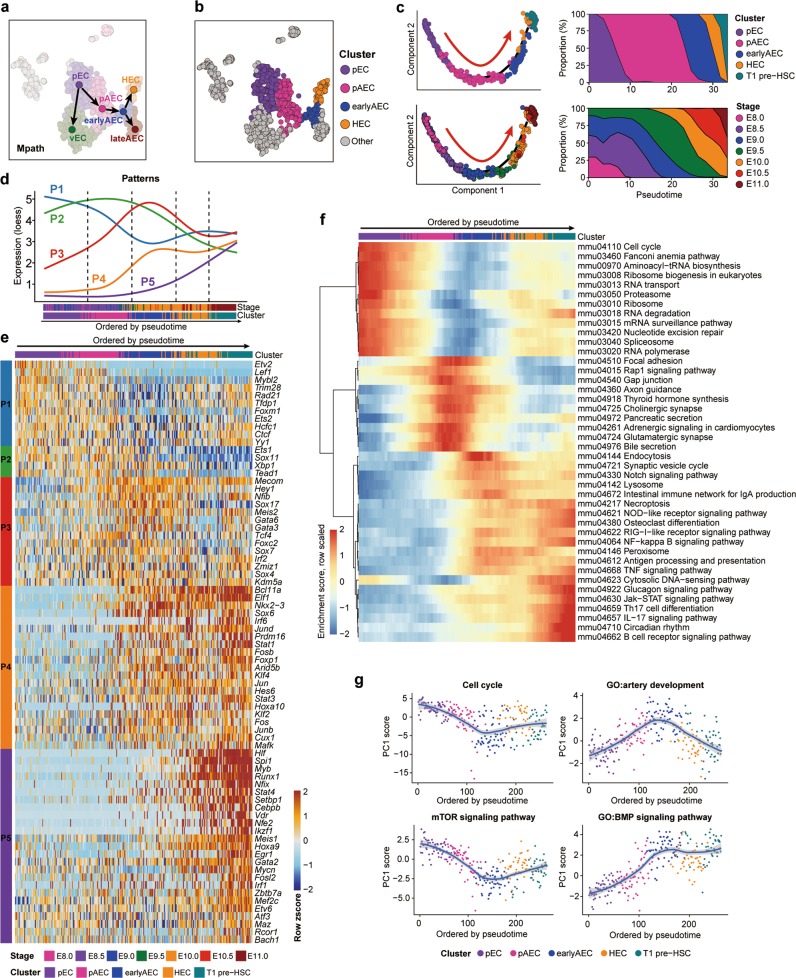
Fig. 6. Molecular evolution underlying the specification of HSC-primed HECs from primitive vascular ECs.
a Trajectories of pEC, vEC, pAEC, earlyAEC, lateAEC and HEC inferred by Mpath. Arrows indicate the development directions predicted by sampling stages. b t-SNE plot showing the distribution of the four clusters involved in hemogenic specification. Other cells are in gray. c Pseudotemporal ordering of the cells included in the indicated five clusters inferred by monocle 2 (left), with clusters (upper left) and sampling stages (lower left) mapped to it. HEC specification directions are indicated as red arrows. Smooth distributions of clusters (upper right) and sampling stages (lower right) along pseudotime by using Gaussian kernel density estimate are shown. d Dynamic changes of five gene expression patterns along the trajectory ordered by pseudotime inferred by monocle 2. For each pattern, principal curves are fitted on expression levels of the genes in that pattern along pseudotemporal order, using local polynomial regression fitting method. Randomly down-sampling is performed in pEC and pAEC clusters for better visualization. e Heatmap showing the relative expression of the core TFs belonging to the regulons, genes in which exhibit significant overlap with the pattern genes. Cells are ordered by pseudotime and TFs are ordered by Patterns. f Heatmap showing smoothed (along adjacent 25 cells) and scaled enrichment scores of top 50 KEGG pathways along the order by pseudotime. Pathways are ordered by hierarchical clustering using ward.D method. g Scatter plots showing the relative activity levels of pathways or GO terms with loess smoothed fit curves and 95% confidence interval indicated. Relative activity levels are represented by the PC1 scores of expression levels of the genes in a given set. The sign or direction of PC1 is corrected according to positive correlation with averaged expression levels.

