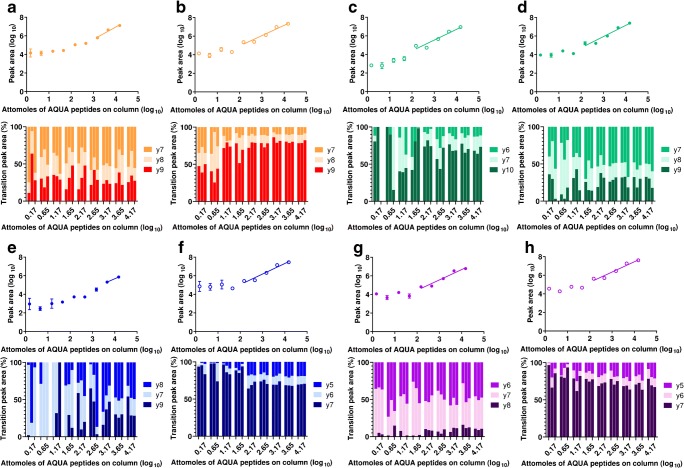
Fig. 2.
Serial isotopic dilution curves and corresponding transitions for heavy labelled peanut allergen peptide markers in depleted serum analysed using the QQQ-MRM method. Peptides were as follows: a Ara h 1 (P43237)329–342; b Arah1 (P43237)555–577; c Arah3 (Q647H4)25–41; d Arah3 (Q647H4)372–384; e Ara h 2 (Q6PSU2)103–115; f Ara h 2 (Q6PSU2)147–155; g Arah6 (Q647G9)136–144; h Arah7 (B4X1D4)143–151. Serum samples were depleted with a MARS-Hu6 column. Calibration curves were created using peptide concentrations from 0 to 15 fmol/μL using samples with qualifying signal-to-noise ratios and ratios of quantifying peak area to total peak area

