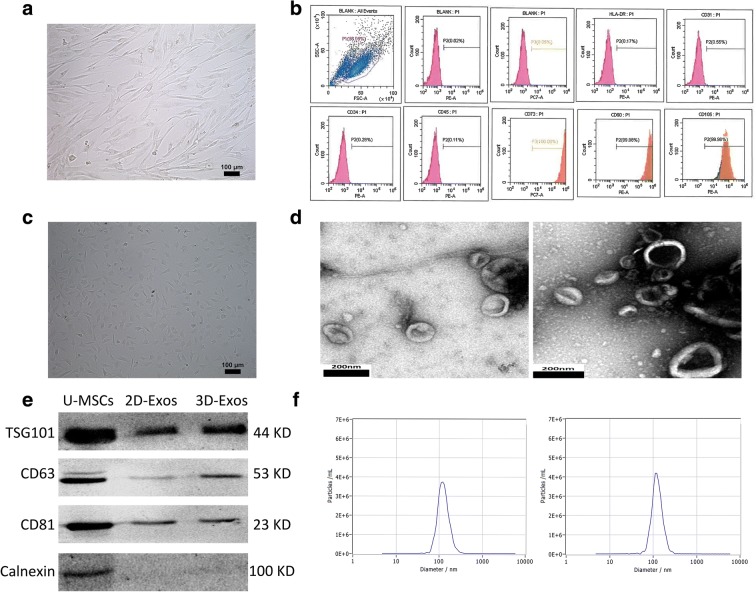
Fig. 1.
Characterization of U-MSCs and exosomes. a Morphological observation of U-MSCs (× 100). b Flow cytometric analysis of umbilical cord mesenchymal positive markers, such as CD105, CD73, and CD90, and negative markers, such as CD31, CD34, CD45, and HLA-DR. c Primary human chondrocyte morphology (× 100). d Morphology of 2D-Exos (left) and 3D-Exos (right) under transmission electron microscopy (scale bar 200 nm). e Western blot analysis of exosome surface markers (TSG101, CD63, CD81, and calnexin). f The concentration and size distribution of 2D-Exos (left) and 3D-Exos (right) by Nanosight

