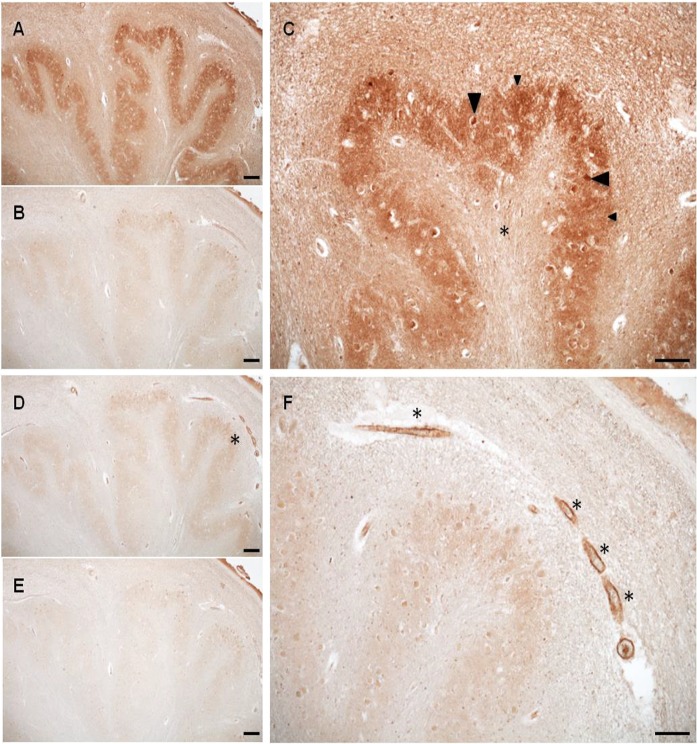
Fig. 4.
Medulla BCATc and BCATm staining. a BCATc staining of the inferior olivary nucleus. b Antigen incubation of serial section, at 200× molar excess. c Increased magnification of the inferior olivary nucleus showing staining of small neurons (large arrow) and neuropil staining (small arrow) along with immunonegative hylum (*). d BCATm staining of the inferior olivary nucleus. e Antigen incubation of serial section, at 200× molar excess. f Vessel staining (*) within the amiculum of the inferior olivary nucleus. Scale bar: a, b, d and e 200 μm; c and f 100 μm. (Hull 2012)

