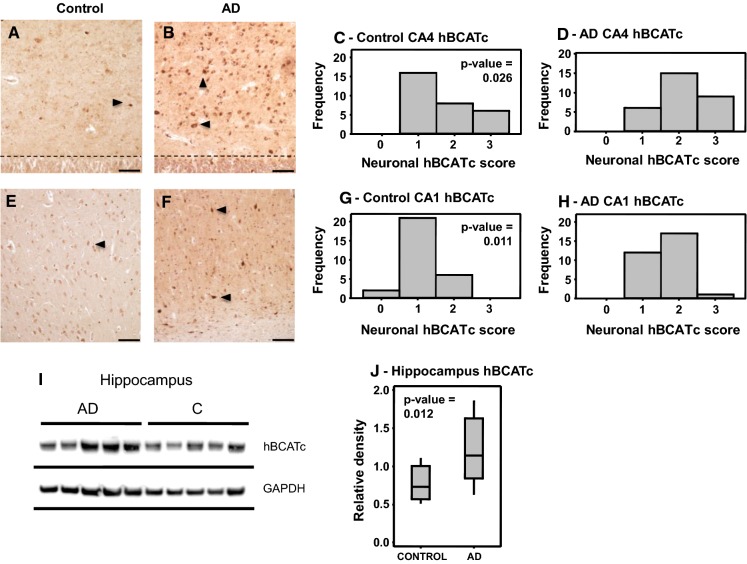
Fig. 5.
Increased hBCATc expression in the hippocampus of AD brains. CA4 region of the hippocampus in a control (a) and AD brain (b) showing intensely labelled neurons (large arrows) and the granule cell layer (dotted line). CA1 region of the hippocampus in a control (e) and AD (f) subject showing intensely labelled neurons (large arrows). c, d, g, h The slides were scored on a 0–3 scoring system and analyzed for significance using the Wilcoxon-Mann-Whitney test in Minitab™ as described in materials and methods. i Western blot analysis of hippocampal tissue. The density of each band was measured using ImageJTM software (Wayne Rasband, National Institute of Health, USA) and analyzed for significance using a one-way ANOVA test in Minitab™. j Interquartile range (box) sample variability (whiskers) and the median (horizontal line within the interquartile range) are shown. Magnification for a, b, e, and f, ×10. Scale bar: 200 μm. (Reprinted from Hull et al. (2015a) with permission from IOS Press)

