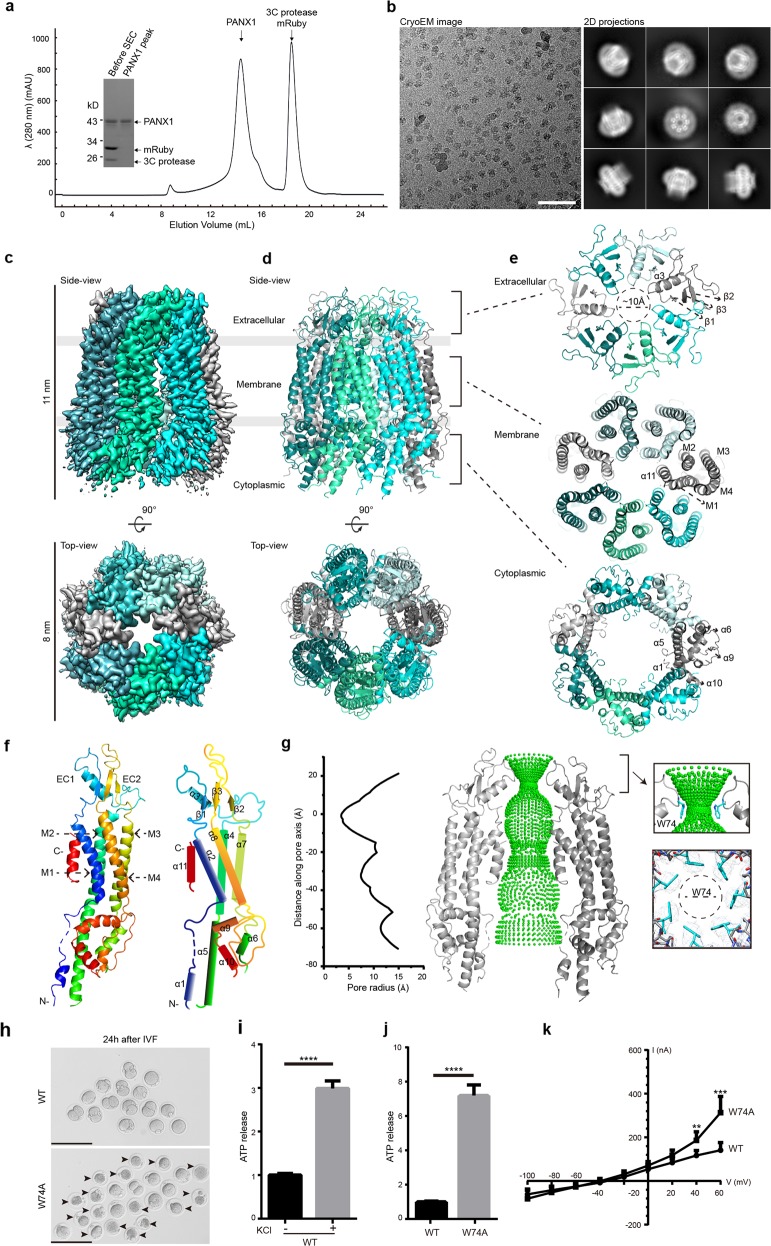
Fig. 1. Cryo-EM structure of the human PANX1 channel.
a A representative size-exclusion chromatogram profile of the purified polymeric PANX1 protein. The inset panel shows the affinity-purified PANX1 protein digested by 3C protease and the peak fraction on an SDS-PAGE gel stained with Coomassie blue. b A representative cryo-EM micrograph and 2D class-averaged images of the PANX1 protein. Scale bar, 60 nm. c, d 3D reconstruction map and model of the PANX1 channel viewed from the side and top with each subunit individually colored. The extracellular, transmembrane, and cytoplasmic regions are indicated. e Three top-down views of the PANX1 extracellular, transmembrane, and cytoplasmic regions corresponding to the brackets in d. Secondary structures are marked. f Protomer structure of PANX1 colored by spectrum and a schematic representation of the secondary structures. g Sphere representation of the pore pathway of the PANX1 channel and the pore radius plot produced by the HOLE program. For clarity, only two subunits are shown. The Cα position of W74 is set to zero. The restriction site controlled by W74 and the local density map are shown in the right panel. h GV oocytes injected with WT or W74A cRNA collected at 6 h after in vitro fertilization. The arrowheads mark the dead zygotes and bars represent 200 µm. i The ATP content measured in HEK293S GnTI− cells transfected with WT PANX1 plasmid, with or without 100 mM KCl stimulation. j The ATP contents measured in HEK293S GnTI− cells transfected with WT or W74A PANX1 plasmid. Bars indicate means ± SEM (n = 4). The data were normalized to the WT group. k Average I-V curves from X. laevis oocytes expressing WT or W74A PANX1. Data are shown as means ± SD (n = 4-8). **P < 0.01, ***P < 0.001 and ****P < 0.0001.

