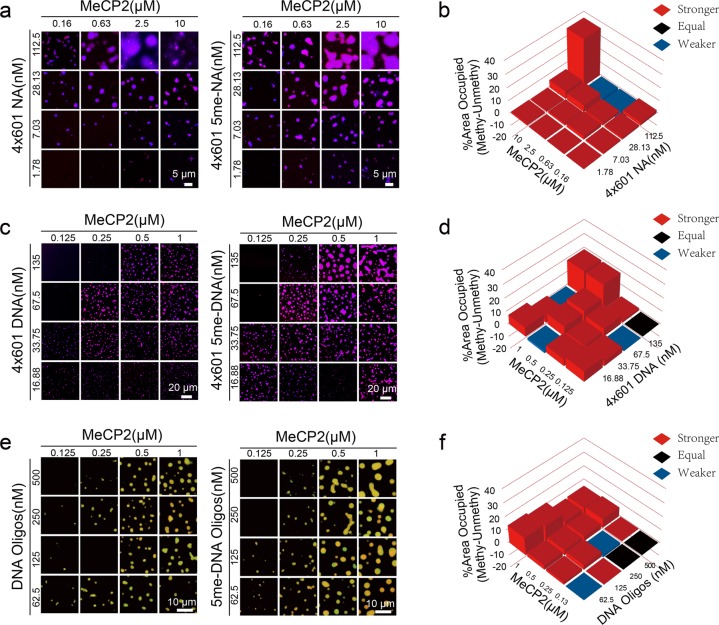
Fig. 2. Effect of DNA methylation on LLPS of MeCP2 with 4×601 DNA or 4×601-NA in vitro.
a Phase diagrams of MeCP2 with 4×601-NA or 4×601 5me-NA. Scale bars, 5 µm. b Comparison of phase diagrams of MeCP2 in a. Value percentage = [Area occupied percentage of Methylation (4×601 5me-NA with MeCP2)] – [Area occupied percentage of Unmethylation (4×601-NA with MeCP2)]. Red squares indicate DNA methylation enhanced the LLPS of MeCP2; black squares indicate no LLPS or methylated DNA acted the same with unmodified DNA the LLPS of MeCP2; blue squares indicate DNA methylation compromised the LLPS of MeCP2. c Phase diagrams of MeCP2 with 4×601 DNA or 4×601 5me-DNA. Scale bars, 20 µm. d Comparison of phase diagrams of MeCP2 in c. Value percentage = [Area occupied percentage of Methylation (4×601 5me-DNA with MeCP2)] – [Area occupied percentage of Unmethylation (4×601 DNA with MeCP2)]. e Phase diagrams of MeCP2 with DNA oligos or 5me-DNA oligos. Scale bars, 10 µm. f Comparison of phase diagrams of MeCP2 in e. Value percentage = [Area occupied percentage of Methylation (5me-DNA Oligos with MeCP2)] – [Area occupied percentage of Unmethylation (DNA Oligos with MeCP2)].

