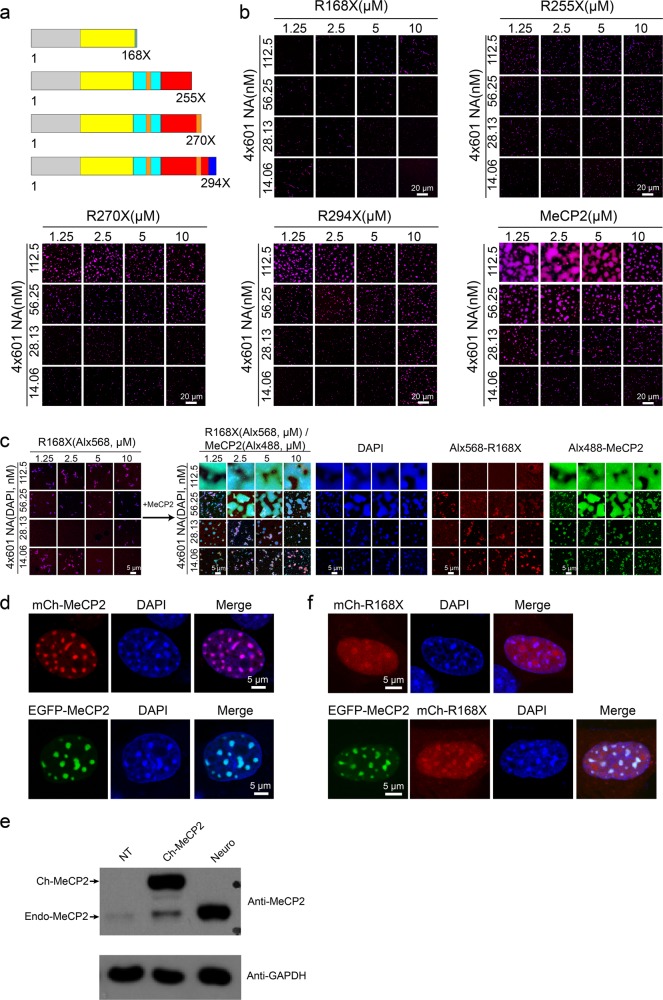
Fig. 3. RTT-related nonsense mutations affect MeCP2-driven chromatin LLPS.
a Diagrams showing the location of the four main RTT-related MeCP2 nonsense mutations. b Phase diagrams of FL MeCP2 and Rett-related MeCP2 nonsense mutations (shown in Fig. 3a) with 4×601-NA. Scale bars, 20 µm. c Inability of MeCP2 R168X to undergo phase separation with 4×601-NA is rescued by addition of extra FL MeCP2 protein. Left panel, phase diagram of MeCP2 R168X with 4×601-NA. Only merged channels are shown here. Right, phase diagrams after addition of FL MeCP2 into the reaction shown in the left panel. Scale bars, 5 µm. d Location of overexpressed mCherry-MeCP2 or EGFP-MeCP2 to heterochromatic chromocenters marked by DAPI in NIH 3T3 cells. Scale bars, 5 µm. e Western blot analysis to check the protein level of overexpressed MeCP2 and endogenous MeCP2 in 3T3 cells and in hippocampal neurons. Top panel, anti-MeCP2 antibody is used. The upper band is the overexpressed mCherry-MeCP2, and the lower bands are endogenous MeCP2. Bottom panel, anti-GAPDH antibody is used. GAPDH is used as the internal control. NT (no transfected 3T3 cells), mCh-MeCP2 (overexpressed mCherry-MeCP2 in 3T3 cells) in d, neuron (hippocampal neurons) in Supplementary information, Fig. S5b. f Dispersion of overexpressed mCherry-MeCP2-R168X alone or with EGFP-MeCP2 in NIH 3T3 cells. Scale bars, 5 µm.

