
Figure 1.
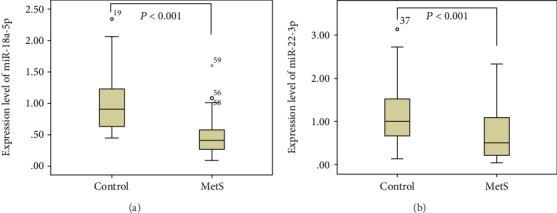
Comparison of microRNA expression in PBMCs among the MetS and control groups. Legend: the expression levels of miR-18a-5p in the MetS group and control group were 0.49 ± 0.31 and 1.05 ± 0.55 (median ± interquartile range), and P value was <0.001; the expression levels of miR-22-3p were 0.60 ± 0.44 and 1.18 ± 0.73 (median ± interquartile range), and P value was <0.001.