
Figure 2.
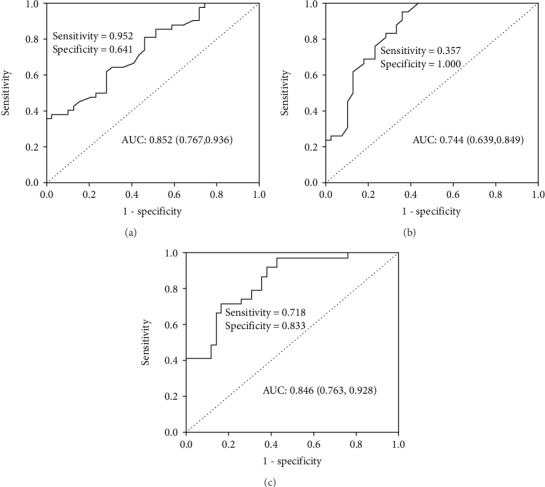
ROC curve analysis of miRNAs for MetS diagnosis. Legend: AUC estimation for the miRNAs: (a) miR-18a-5p, (b) miR-22-3p, and (c) ROC plot for the microRNA panel (miR-18a-5p, miR-22-3p) discriminating MetS. Abbreviations: AUC: area under the curve; ROC: receiver operating characteristic.