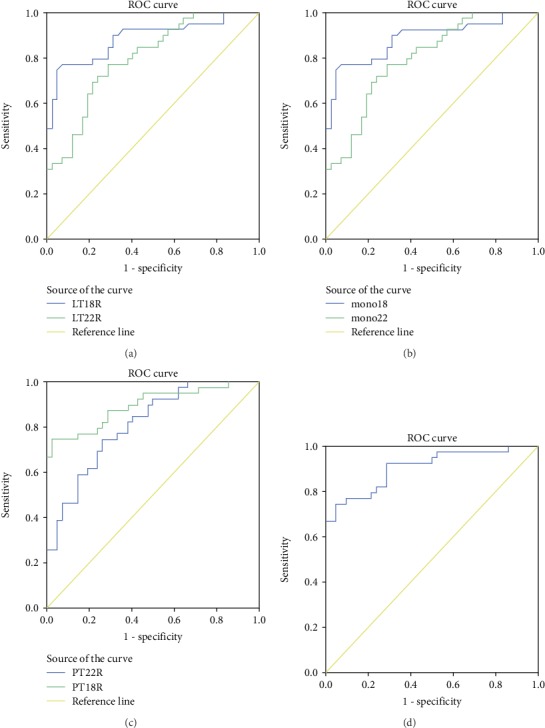
Figure 3.

ROC curve analysis of inflammatory cells to the two miRNA ratios for MetS diagnosis. Legend: AUC estimation for the rates of inflammatory cells to the two miRNAs. (a) ROC curves for LT18R and LT22R, (b) ROC curves for MT18R and MT22R, (c) ROC curves for PT18R and PT22R, and (d) ROC curve for PT18R-PT22R panel. Abbreviations: AUC: area under the curve; ROC: receiver operating characteristic; LT18R: lymphocyte to miR-18a-5p ratio; LT22R: lymphocyte to miR-22-3p ratio; MT18R: monocyte to miR-18a-5p ratio; MT22R: monocyte to miR-22-3p ratio; PT18R: PBMCs to miR-18a-5p ratio; PT22R: PBMCs to miR-22-3p ratio.
