Figure 5.

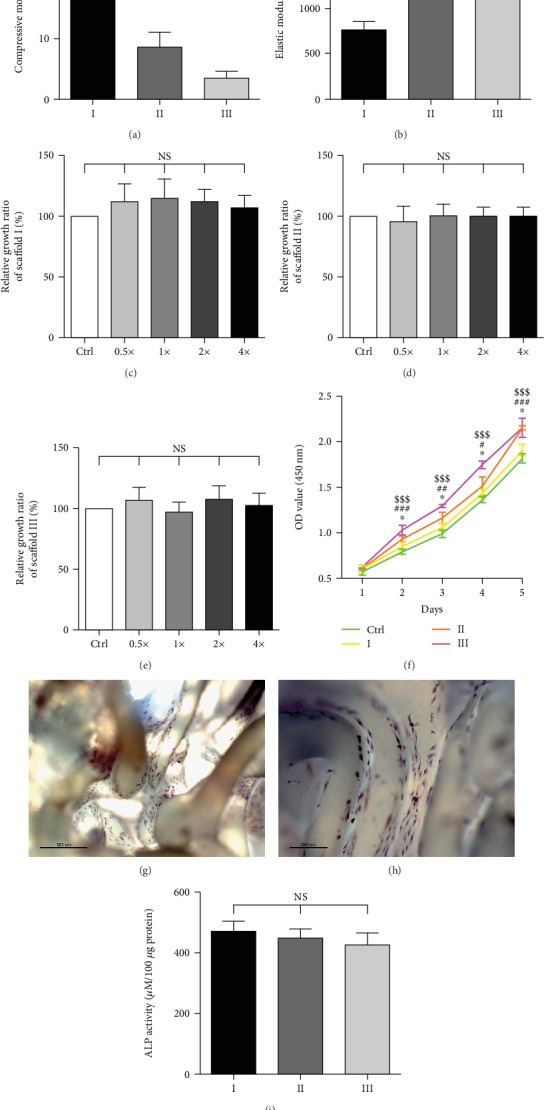
Influence of filling rates on scaffold properties. (a) Compressive modulus of PLLA scaffolds (n = 5, ∗∗P < 0.01, ∗∗∗P < 0.001). (b) Elastic modulus of different PLLA scaffolds (n = 5, ∗∗∗P < 0.001). (c) The influence of different concentrations of extracts from scaffold I on BMSC growth (n = 5, NS = not significant; Ctrl = control group). (d) The influence of different concentrations of extracts from scaffold II on BMSC growth (n = 5, NS = not significant; Ctrl = control group). (e) The influence of different concentrations of extracts from scaffold III on BMSC growth (n = 5, NS = not significant; Ctrl = control group). (f) The proliferation curves of BMSCs on scaffolds I, II, and III for 1-5 days (n = 5, ∗P < 0.05 vs. scaffold I, #P < 0.05 vs. scaffold II, ##P < 0.01 vs. scaffold II, ###P < 0.001 vs. scaffold II, $$$P < 0.001 vs. scaffold III, Ctrl = control group). (g) Alkaline phosphatase (ALP) staining of BMSCs on scaffolds after osteogenic differentiation for 7 days (40x) (scale bar = 500 μm). (h) ALP staining of BMSCs on scaffolds after osteogenic differentiation for 7 days (100x) (scale bar = 200 μm). (i) ALP activity of BMSCs on scaffolds after osteogenic differentiation for 7 days (NS = not significant).
