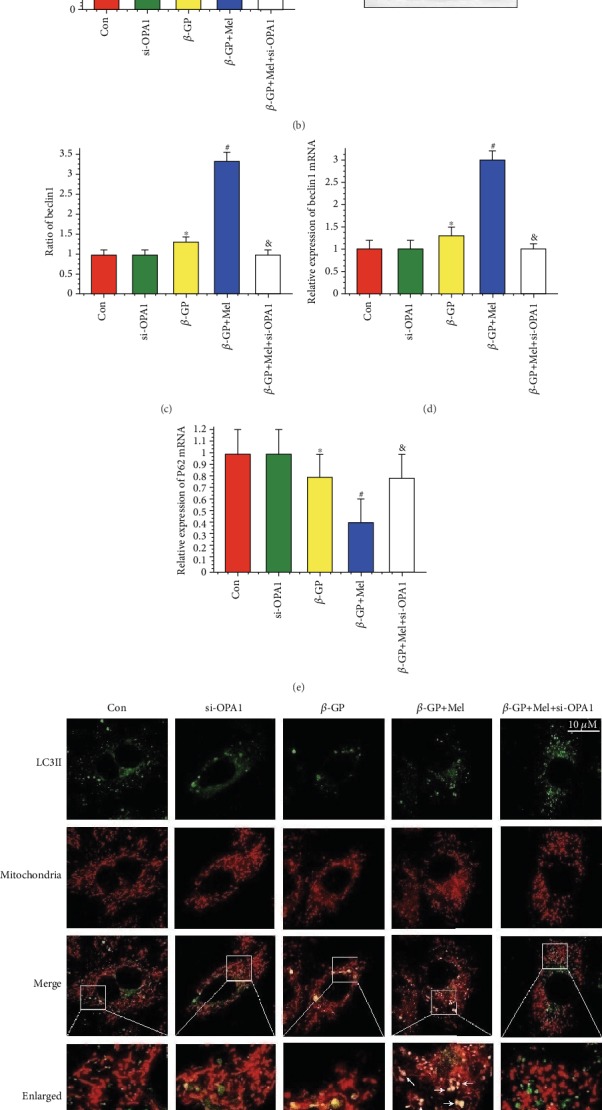
Figure 6.

Effects of melatonin on mitophagy in β-GP-treated VSMCs (n = 6/group). (a–c) Results of LC3II/I, mito-LC3II, and beclin1 protein expression. (d) Result of beclin1 mRNA expression. (e) Result of P62 mRNA expression. (f, g) The colocation of LC3II and mitochondria in VSMCs. (h) Result of OPA1 overexpression (Ad-OPA1) or autophagy protein 5 knockout (si-ATG5) on ALP activity. ∗P < 0.05 vs. Con, #P < 0.05 vs. β-GP, and &P < 0.05 vs. β-GP+Mel.
