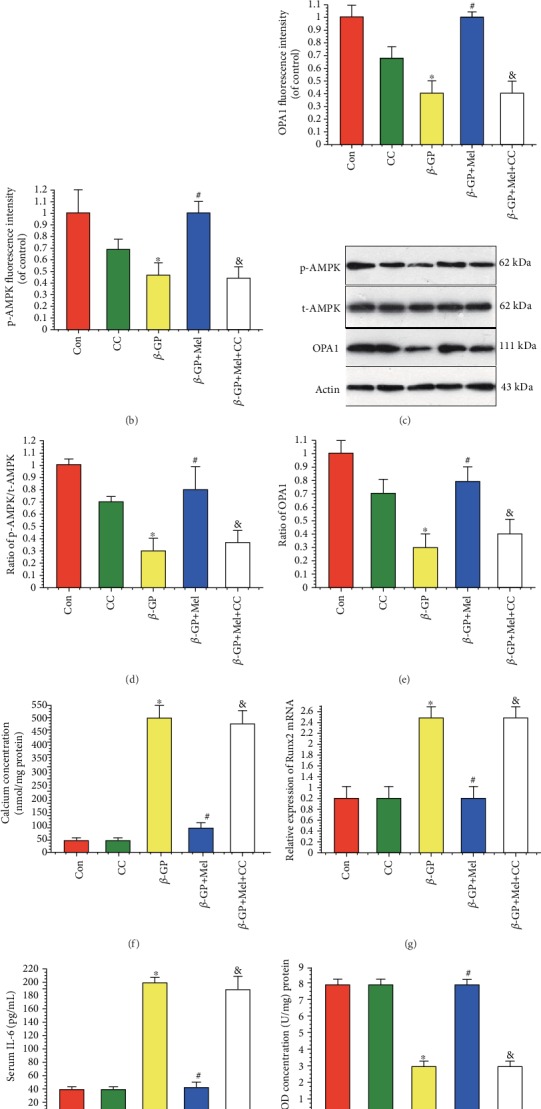
Figure 7.

Effects of melatonin and AMPK pathway inhibitor (compound C, 1 μM) on β-GP-induced calcification in VSMCs (n = 6/group). (a–c) Results of immunofluorescence assay (red signal represents p-AMPK, green signal represents OPA1). (d, e) Results of p-AMPK and OPA1 protein expression. (f) Result of calcium concentration. (g) Result of Runx2 mRNA expression. (h) Result of interleukin-6 (IL-6) level. (i) Result of SOD level. (j) Result of caspase 3 activity. ∗P < 0.05 vs. Con, #P < 0.05 vs. β-GP, and &P < 0.05 vs. β-GP+Mel.
