Figure 4.

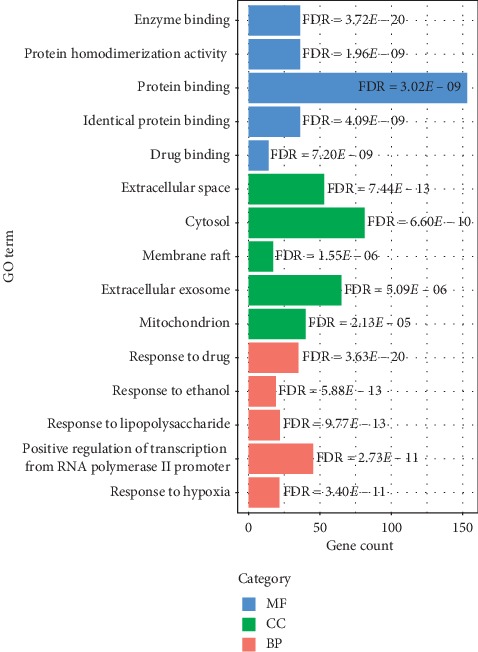
The barplot for GO analysis of common target genes. The top five significantly enriched GO terms in each category ranked according to FDR. FDR: false discovery rate.

The barplot for GO analysis of common target genes. The top five significantly enriched GO terms in each category ranked according to FDR. FDR: false discovery rate.