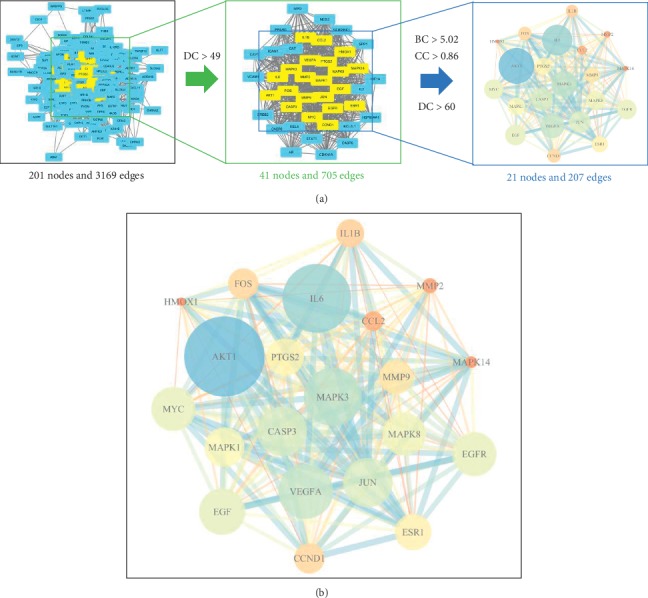
Figure 5.

PPI networks of CCMMs and PLC. (a) The screening process of the target genes. The screening criteria by which the key target genes were identified were DC > 49, BC > 5.02, and CC > 0.86. (b) PPI network of CCMMs and PLC with 21 nodes and 207 edges. Nodes indicate key target genes. The size of the nodes and edges corresponds to the value of degree and combine score, respectively. The color of the nodes represents the value of degree. The darker (blue) the color, the higher the degree. DC: degree centrality; BC: betweenness centrality; CC: closeness centrality.
