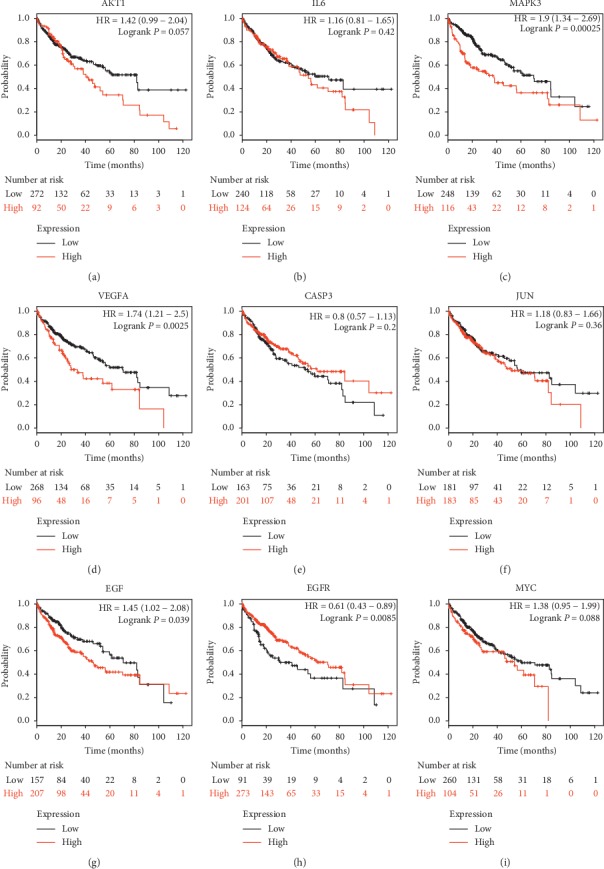
Figure 6.

The prognostic values of expression levels of key genes in PLC patients. (a–i) The K–M survival curves of nine top key genes. High expression levels of MAPK3 (c), VEGFA (d), EGF (g) were associated with worse OS in PLC patients, and high expression level of EGFR (h) was correlated with longer OS. (a, b, e, f, i) Other genes showed no significant difference. OS: overall survival; K–M: Kaplan–Meier.
