Figure 2.

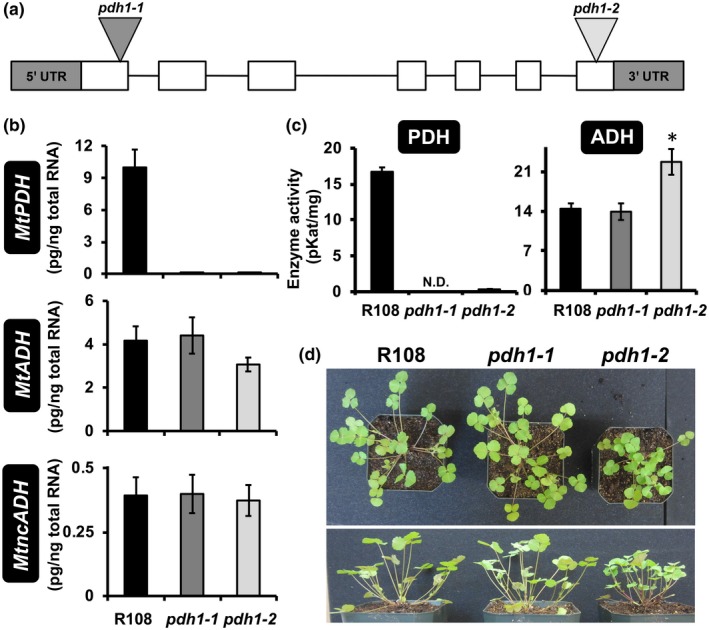
Isolation of Medicago pdh1 mutants. (a) MtPDH1 (Mt3g071980) genomic structure, exons (white boxes) and introns (lines), 5′ and 3′ untranslated regions (UTR, gray boxes). Two Tnt1‐transposon mutants were isolated with insertions in exon one (pdh1‐1) and seven (pdh1‐2). (b) MtPDH1 transcripts were nearly abolished in pdh1‐1 and pdh1‐2, without affecting expression of either ADH homolog. Bars represent average absolute mRNA levels (pg/ng total RNA) ± SEM of three biological replicates. (c) PDH and ADH activity from mutants and wild‐type (Wt, R108). Bars represent average enzymatic activity (pKat/mg) ± SEM of three biological replicates. Significant differences to R108 control are indicated; *p ≤ .05. (d) Phenotype of R108 and mutants after 6‐week growth under standard conditions
