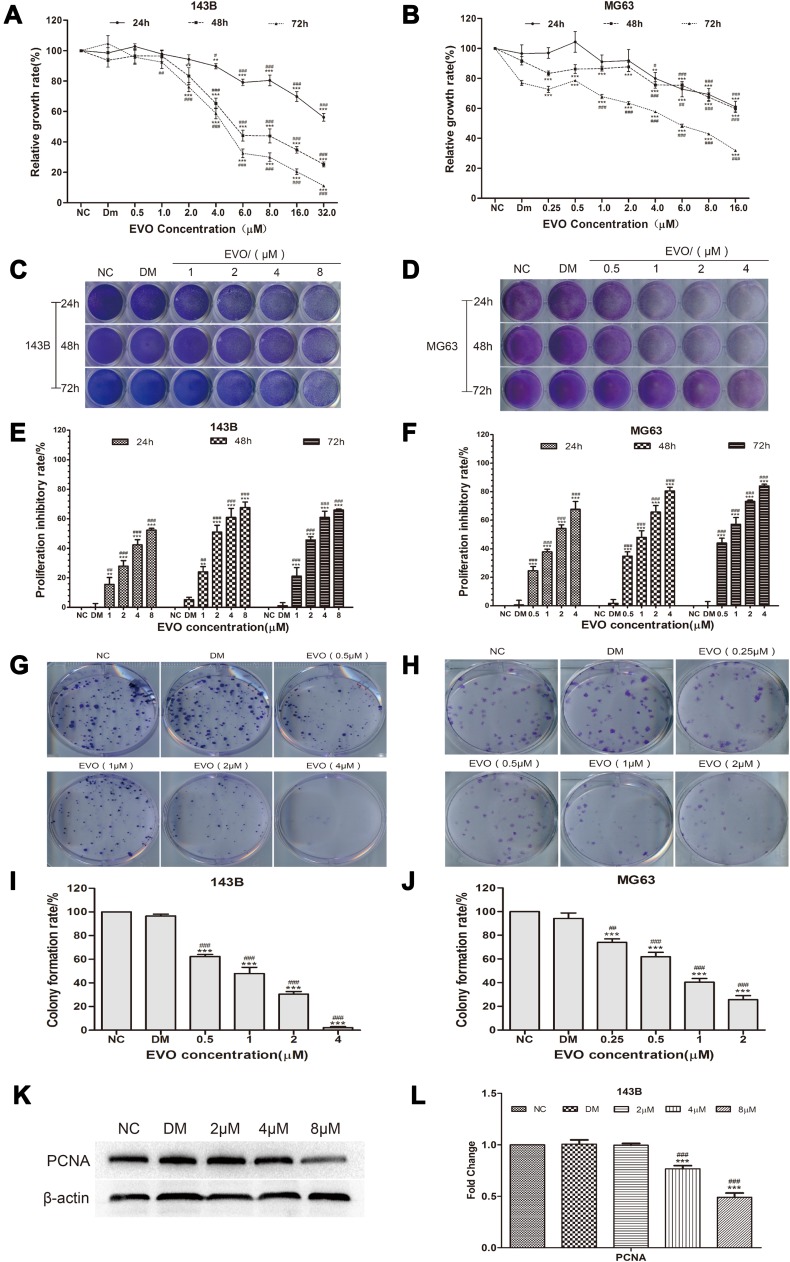
Figure 1.
EVO inhibits the growth of 143B and MG63 cells. Human osteosarcoma cell lines, (A) 143B and (B) MG63 cells were treated with EVO with various dosages and the cell viabilities were examined by MTT assay. The data are presented as the mean ± SD (n=3, each group). **p<0.01, ***p<0.001 vs NC group; #p<0.05, ##p<0.01, ###p<0.001 vs DMSO group. (C and D) The crystal violet staining result in 143B and MG63 cells were seeded in 24-well plates and treated with different concentrations of EVO or DMSO, followed by crystal violet staining at the indicated time-points. (E and F) Quantitative results of crystal violet staining in 143B and MG63 cells. The data are presented as the mean ± SD (n=3, each group). **p<0.01, ***p<0.001 vs NC group; #p<0.05, ##p<0.01, ###p<0.001 vs DMSO group. (G and H) 500 cells/well were seeded in plates and the medium was changed every 4 days. After 14 days, the plates were stained for the formation of cell colonies with crystal violet dye. (I and J) The number of colonies was counted. The data are presented as the mean ± SD (n=3, each group). ***p<0.001 vs NC group; ##p<0.01, ###p<0.001 vs DMSO group. (K and L) Western blot assay results show the PCNA protein level in 143B cells with β-actin as loading control. The quantitative results are presented as the mean ± SD (n=3, each group). ***p<0.001 vs NC group; ###p<0.001 vs DMSO group.

