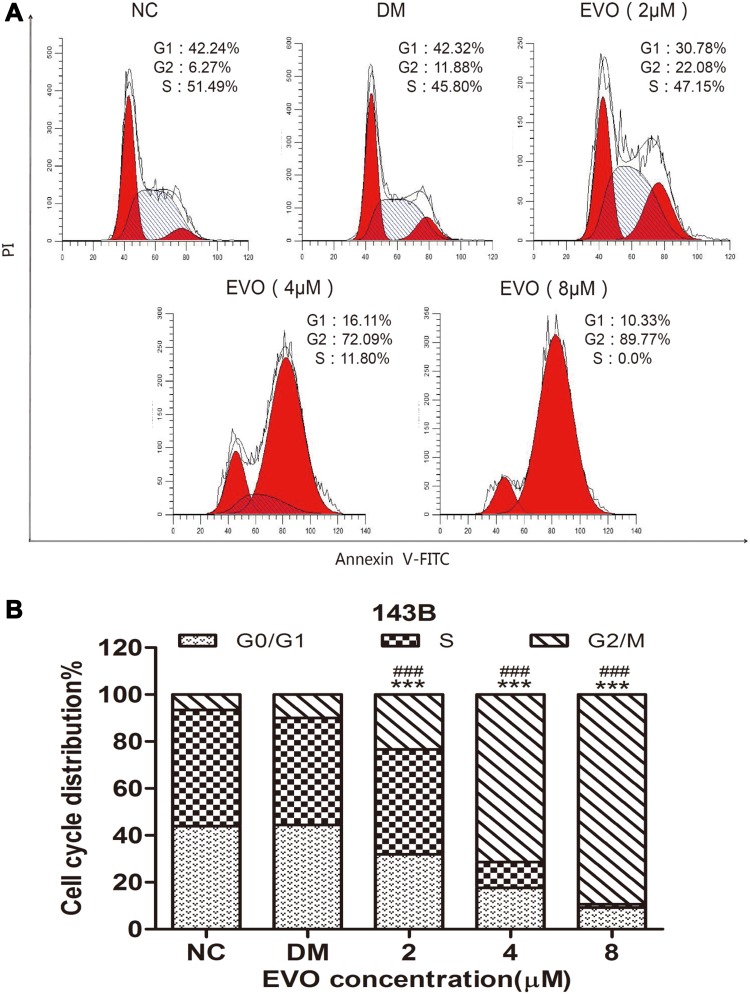
Figure 2.
EVO induced cell cycle arrest at the G2/M phase. (A) The representative FACS plots displayed differences in cell cycle phases of 143B cells treated with different concentrations of EVO or DMSO. (B) Bar graphs show that EVO led to cell cycle arrest at the G2/M phase in 143B cells. The data are presented as the mean ± SD (n=3, each group). ***p<0.001 vs NC group; ###p<0.001 vs DMSO group.

